AMERICAN SOCIETY
OF EXERCISE PHYSIOLOGISTS
Founded, 1997
Journal
of Exercise Physiologyonline
ISSN
1097-9751
An International Electronic
Journal for Exercise
Physiologists
Volume 2 Number 3 July
1999
Systems Physiology Neuromuscular and Skeletal
Influence of electrode orientation on electromyographic fatigue indices of the vastus lateralis
JOSEPH P. WEIR, KELLY P. MAHONEY, KATHERINE G. HAAN and AMANDA DAVIS
Program in Physical Therapy,
University of Osteopathic Medicine and Health Sciences
3200 Grand Avenue, Des
Moines IA, 50312
Influence of Electrode
Orientation on Electromyographic Fatigue Indices of the Vastus Lateralis.
JOSEPH P. WEIR, KELLY P. MAHONEY, KATHERINE G. HAAN and AMANDA DAVIS. JEPonline
1999, 2(3):15-22.
Monitoring of muscle fatigue
in the leg extensors can provide valuable information regarding exercise
and rehabilitation. Surface electromyography (EMG) can provide objective
measures for monitoring fatigue. However, factors such as electrode orientation
relative to muscle fiber direction can potentially affect EMG fatigue indices.
That is, bipolar electrodes should be aligned parallel to the muscle fibers,
but in pennated muscles alignment of electrodes parallel to the muscle
fibers is problematic. The purpose of this study was to examine the effect
of alterations in electrode orientation on EMG changes during fatiguing
isometric contractions. Electrodes were placed parallel and perpendicular
to the long axis of the vastus lateralis of thirty subjects who performed
a quadriceps contraction for 60 seconds at 50% of their maximal isometric
contraction. The data were analyzed for changes in median power frequency
(MPF) and integrated EMG (iEMG) over time. Slopes from individual regression
analyses, normalized to the subjects maximal values, were the dependent
variables (units = %max·sec-1).
Paired t-tests indicated that the fatigue slopes for MPF (parallel = -0.13
± 0.13; perpendicular = -0.21 ± 0.20 ; t = 1.75, p=.09) and
iEMG (parallel = 0.22 ± 0.17; perpendicular = 0.25 ± 0.19;
t = 1.52, p=.14) were not significantly different between orientations.
However, the correlation analysis for MPF slopes showed no significant
relationship between parallel and perpendicular measures (r= 0.05, SEE
= 0.29). In contrast, the correlation analysis for iEMG slopes indicated
a significant relationship between orientations (r=.77, SEE = 0.13, p<.05).
These findings suggest that electrode orientation can significantly affect
frequency domain indices of fatigue while amplitude measures are less sensitive
to alterations in electrode orientation. In pennated muscles such as the
vastus lateralis, use of amplitude measures of fatigue may be preferable.
Key words: EMG, isometric contraction, skeletal muscle
INTRODUCTION
The leg extensors are critically important during activities of daily living (7), exercise, and rehabilitation protocols. Fatigue in these muscles can affect function, and monitoring of quadriceps fatigue can provide insight into the effectiveness of therapeutic interventions. While fatigue can be assessed by examining changes in force or torque production over time, these recordings may not be practical in all situations. Alternatively, electromyography (EMG) can be used to study local muscular fatigue and involves measuring changes that occur in the EMG signal in the time and/or frequency domain (4,13). During fatigue from submaximal isometric contractions, EMG amplitude increases while markers of EMG frequency characteristics (e.g., median power frequency) trend towards lower values. The increase in EMG amplitude has been suggested to reflect fatigue-induced increases in motor unit recruitment and/or firing rate (4, 6,15) while the decrease in median power frequency may reflect decreases in muscle fiber conduction velocity (5,17), however the mechanisms underlying these effects are still under investigation. An advantage of EMG fatigue assessment is that these fatigue indices are unaffected by psychological factors associated with fatigue and allow for the detection of fatigue-induced changes in muscle electrical activity that occur prior to measured changes in force production (3).
While EMG has a long history as a fatigue research tool, surprisingly little is known regarding the effect of electrode orientation on EMG fatigue responses (20). Loeb and Gans (14) suggest that surface electrodes should be orientated such that the pick-up surfaces lie parallel to the muscle fibers as this will place the electrodes parallel to the line of action potential conduction. That is, optimal recording of muscle electrical activity will occur when the contact surfaces of bipolar electrodes are parallel to the direction of the voltage gradient of the tissue (14). However, in muscles like the quadriceps, the angle of pennation makes placement of electrodes relative to fiber orientation problematic. Some investigators have attempted to place the electrodes over quadriceps muscles in line with the presumed orientation of the fibers (9, 11), however the actual pennation angle is not readily measured, can vary considerably between subjects (12), and varies as a function of muscle force (8, 10) and joint angle (8,16). Alternatively, electrodes have simply been oriented in line with the long axis of the muscle belly (19) and in many cases the electrode orientation has not been reported (e.g., 1,2). Therefore, assessment of fatigue in pennated muscles like the quadriceps based on surface EMG may be affected by differences in electrode orientation. In this investigation, we maximally altered electrode orientation (90 degrees) over the vastus lateralis during fatiguing isometric exercise and examined the effect of these changes on EMG amplitude and median power frequency fatigue indices.
METHODS
Subjects
Eighteen female and 12 male volunteers
participated in this investigation. The subjects were between the
ages of 19 and 40 years (mean age ± SD = 25 ± 3.5 years;
height = 173 ± 9.4 cm; mass = 67 ± 12.1 Kg) and each subject
completed a health questionnaire and signed an informed consent form.
All procedures were approved by the local Institutional Review Board.
Experimental Procedures
The testing protocol and signal processing
(described below) were patterned after that described in a previous communication
(19). Specifically, each subject performed a five minute
warm-up consisting of unloaded stationary cycling at 50 rpm, followed by
standing quadriceps stretching. Following the warm-up, each subject
performed a series of isometric contractions of the right knee extensors
on a KinCom isokinetic dynamometer at a joint angle .785 rad (45 degrees)
from full extension. Prior to testing, the axis of rotation of the dynamometer
was carefully aligned with the axis of rotation of the knee. The subjects
were then stabilized at the hip and ankle and were instructed to firmly
grasp towel handles located at the side of the dynamometer chair. Following
positioning and stabilization, each subject performed three maximal isometric
contractions. Each contraction was held for approximately five seconds,
and contractions were separated by three minutes of rest. From each contraction,
the one-second interval with the highest mean force was determined. The
EMG signals from the corresponding time interval were isolated for analysis
(see below). The highest force from the three maximal contractions was
considered the maximal voluntary contraction (MVC). Five minutes
following the determination of the MVC, subjects performed a one minute
contraction at an intensity equal to 50% MVC. The 50% criterion was
maintained by having the subjects view the KinCom monitor on which their
50% MVC value was clearly identified. Once the contractions were
stabilized at 50% MVC, a stop watch was utilized to time the contractions
and the subjects were verbally encouraged to maintain the contraction throughout
the test.
Instrumentation
Surface EMG activity was recorded over
the vastus lateralis muscle. We chose the vastus lateralis because it is
commonly used for quadriceps EMG fatigue assessment, is not affected by
changes in hip angle as is the rectus femoris, and does not exhibit anatomical
heterogeneity like the vastus medialis (i.e., vastus medialis oblique).
The EMG data were recorded from two sets of bipolar surface electrode assemblies,
one orientated perpendicular and the other parallel to the long axis of
the muscle belly. The sets of electrode assemblies were placed midway
between the inguinal ligament and superior pole of the patella over the
vastus lateralis muscle as determined by palpation. A common reference
electrode was placed over the crest of the tibia. Proximal versus distal
positioning of the parallel and perpendicular electrode assemblies was
determined at random for each subject. To reduce inter-electrode impedance,
the skin underlying the electrode was vigorously cleaned with alcohol swabs
prior to electrode placement. The EMG signals were pre-amplified
(x35) at the skin (model D-100 pre-amplifier, Therapeutics Unlimited, Iowa
City IA; characteristics: Ag/Ag Cl bipolar electrodes, 2 cm center-to-center
inter-electrode spacing, input impedance > 25M![]() at DC and >15M
at DC and >15M![]() at 100 Hz; and
again downstream (model EMG-55 driver amplifier, Therapeutics Unlimited,
Iowa City IA; characteristics: 87dB common mode rejection ratio at 60Hz,
bandwidth = 20-4000 Hz). The total system gain was adjusted for each subject
to allow maximum amplification without saturation of the analog-to-digital
converter. All signals were interfaced with a BNC connector board
(BNC 2080, National Instruments, Austin TX) to a 12 bit analog-to-digital
converter (AT-MIO-16E-10, National Instruments, Austin TX) with a sampling
rate for each channel of 1000 Hz.
at 100 Hz; and
again downstream (model EMG-55 driver amplifier, Therapeutics Unlimited,
Iowa City IA; characteristics: 87dB common mode rejection ratio at 60Hz,
bandwidth = 20-4000 Hz). The total system gain was adjusted for each subject
to allow maximum amplification without saturation of the analog-to-digital
converter. All signals were interfaced with a BNC connector board
(BNC 2080, National Instruments, Austin TX) to a 12 bit analog-to-digital
converter (AT-MIO-16E-10, National Instruments, Austin TX) with a sampling
rate for each channel of 1000 Hz.
Signal Processing
All signal processing was performed with
custom programs written with LabVIEW programming software (National Instruments,
Austin TX). For the amplitude analysis, the EMG signal from each electrode
was divided into sixty one-second segments. For each segment, the
data were full wave rectified and integrated. The integrated EMG
(iEMG) values for all sixty segments were regressed against time and the
slope of the iEMG versus time relationship was recorded as the dependent
variable. Similarly, for the frequency analysis each one-second segment
was processed with a Hamming window function and subsequently analyzed
with a discrete Fourier transform. From the resulting power density spectrum,
the median power frequency (MPF) was determined as the frequency (Hz) which
divided the power density spectrum into two halves of equal area. The slope
of the regression of MPF versus time was the dependent variable for the
frequency analysis. For both the iEMG and MPF analyses, the one-second
data segments were normalized to the respective iEMG and MPF values recorded
during the MVC.
Statistical Analyses
For both the iEMG and MPF data, paired
t-tests were used to examine mean differences between the parallel and
perpendicular slopes. Similarly, Pearson product moment correlation
coefficients and simple linear regression were used to examine the relationships
between the slopes from the parallel and perpendicular conditions.
An alpha level of .05 was considered significant for all analyses.
RESULTS
The results of the paired t-test for the MPF data (see Figure 1) showed no significant difference between the parallel and perpendicular slopes (parallel = -0.13 ± 0.13 %max·sec-1; perpendicular -0.21 ± 0.21; t = 1.75; p = .09). Similarly, the iEMG analysis was non-significant (parallel = 0.22 ± 0.17 %max·sec-1; perpendicular = 0.25 ± 0.19; t = 1.52; p = 0.14).
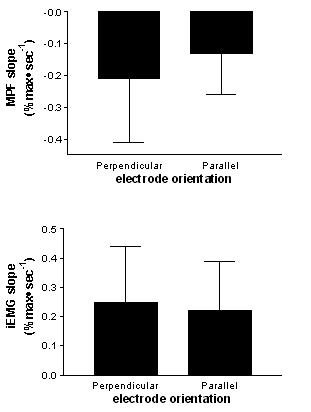
Figure 1. Mean (SD) slope values with parallel and perpendicular electrode orientations for the MPF (top) and iEMG (bottom) data. For both the MPF (p = .09) and iEMG data (p = .14), differences between orientations were not significant.
However, the correlation analysis for the MPF data (see Figure 2) indicated that there was no significant relationship between the parallel and perpendicular slopes (r = .05, SEE = 0.29, p < .05). In contrast, the iEMG analysis did show a significant correlation between the parallel and perpendicular slopes (r = 0.77; SEE = 0.13, p < .05).
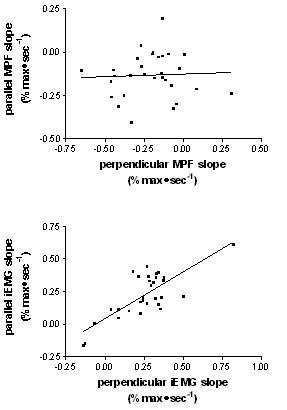
Figure
2. Relationship between parallel and perpendicular slope values for
the MPF (top) and iEMG (bottom) data. For the MPF data, the correlation
between orientations was non-significant (r = .05, p>.05) while the correlation
between slopes for the iEMG data was significant (r = 0.77, p < .05).
DISCUSSION
It was hypothesized that alteration of electrode orientation relative to the muscle belly would alter the frequency and amplitude characteristics of the EMG signal during a prolonged contraction at 50% MVC. Our results indicate that while both measures were affected by the electrode orientation, frequency measures were more sensitive to changes in electrode orientation than were the amplitude measures.
Neither of the paired t-tests showed a significant difference in the mean slopes derived from the parallel and perpendicular electrodes. This indicates that there was no systematic change in frequency and amplitude slopes as a result of the manipulation of electrode orientation. However, the correlation analyses did indicate an effect of electrode orientation. The correlation analysis involving MPF was not significant (r2 = 0.0026). In contrast, the amplitude analysis found a much stronger and statistically significant relationship (r2 = 0.59) between the iEMG slopes of respective electrode orientations. These results indicate that there is less error in EMG amplitude estimates of fatigue than frequency estimates following manipulation of the electrode orientation.
With respect to assessing fatigue of the quadriceps muscles, two points are of note. First, caution should be exercised when interpreting frequency domain measures of fatigue. The angle of pennation has been shown to vary with changes in force level (8,10) and with changes in joint angle (8,16). As our data indicate that changes in electrode orientation markedly affect MPF fatigue slopes, it follows that changes in pennation angle due to changes in force and/or joint angle will affect MPF fatigue estimates and introduce error in studies of fatigue of these muscles. The iEMG slopes are more resistant to these effects and may provide more stable measurements. In addition, we have recently reported that iEMG fatigue curves from the vastus lateralis were more reliable than MPF data derived from the same signals (18), further supporting the preferential use of iEMG over MPF measures from the vastus lateralis.
Second, these data indicate that one must be consistent with electrode positioning in terms of orientation in order to eliminate potential sources of error in repeated EMG assessments of fatigue. However, it should be noted that in this protocol the maximum deviation possible in orientation between electrode assemblies was created. We chose not to attempt to try to orient an electrode assembly in parallel with the estimated fiber orientation because we did not feel that accurate orientation could be achieved. In practice, repeated electrode placement would result in much less deviation than in this study and thus the correlation between electrode leads should increase accordingly.
SUMMARY
Manipulation of electrode orientation significantly affected MPF derived fatigue curves from the vastus lateralis, but had lesser effects on iEMG data. Although electrode placement parallel to the muscle fiber is likely ideal, in a pennate muscle such as the vastus lateralis, muscles fibers do not run parallel to the axis of the muscle belly, thus it is difficult to orient surface electrodes parallel to the line of axis of the actual fibers. In situations where electrode orientation relative to muscle fiber direction is uncertain, use of time domain fatigue indices may be preferable.
REFERENCES
1. Badier M, Guillot C, Lagier-Tessonnier F, Burnet H, Jammes Y. EMG power spectrum of respiratory and skeletal muscle during static contraction in healthy men. Muscle Nerve 16: 601-609, 1993.
2. Christensen H, Fuglsang-Frederiksen A. Quantitative surface EMG during sustained and intermittent submaximal contractions. Electoenceph Clin Neurophysiol 70: 239-247, 1988.
3. DeLuca CJ. Myoelectrical manifestations of localized muscular fatigue in humans. CRC Crit Rev Biomed Engr 11: 251-279, 1984
4. deVries HA. Method for evaluation of muscle fatigue and endurance from electromyographic fatigue curves. Am J Phys Med 47: 125-134, 1968
5. Eberstein A, Beattie B. Simultaneous measurement of muscle conduction velocity and EMG power spectrum changes during fatigue. Muscle Nerve 8: 768-773, 1985
6. Edwards RG, Lippold OCJ. The relation between force and integrated electrical activity in fatigued muscles. J Physiol (Lond) 132: 677-681, 1956
7. Fiatarone MA, Marks EC, Ryan ND, Meredith CN, Lipsitz LA, Evans WJ. High-intensity strength training in nonagenarians. Effects on skeletal muscle. J Am Med Assoc 263: 3029-3034, 1990
8. Fukunaga T, Ichinose Y, Ito M, Kawakami Y, Fukashiro S. Determination of fascicle length and pennation in a contracting human muscle in vivo. J Appl Physiol 82: 354-358, 1997
9. Grabiner MD, Koh TJ, Miller GF. Fatigue rates of vastus medialis oblique and vastus lateralis during static and dynamic knee extension. J Orthop Res 9: 391-397, 1991
10. Henriksson-Larsen K, Wretling ML, Lorentzon R, Oberg L. Do muscle fibre size and fibre angulation correlate in pennated human muscles? Eur J Appl Physiol 64: 68-72, 1992
11. Jansen R, Ament W, Verkerke GJ, Hof AL. Median power frequency of the surface electromyogram and blood lactate concentration in incremental cycle ergometry. Eur J Appl Physiol 75: 102-108, 1997
12. Kawakami Y, Abo T, Fukunaga T. Muscle-fiber pennation angles are greater in hypertrophied than in normal muscles. J Appl Physiol 74: 2740-2744, 1993
13. Lindstrom L, Magnussen R, Petersen I. Muscular fatigue and action potential conduction velocity changes studied with frequency analysis of EMG signals. Electromyography 10: 341-356, 1970
14. Loeb GE, Gans C. Electromyography for Experimentalists. University of Chicago Press, Chicago, 1986
15. Moritani T, Muro M, Nagata A. Intramuscular and surface electromyogram changes during muscle fatigue. J Appl Physiol 60: 1179-1185, 1986
16. Rutherford OM, Jones DA. Measurement of fibre pennation using ultrasound in the human quadriceps in vivo. Eur J Appl Physiol 65: 433-437, 1997
17. Sadoyama T, Masuda T, Miyano H. Relationships between muscle fibre conduction velocity and frequency parameters of surface EMG during sustained contraction. Eur J Appl Physiol 51: 247-256, 1983
18. Weir JP, Lloyd BR, Tussing AM, Green MS, Mayer SJ. Reliability of electromyographic fatigue curves. Med Sci Sports Exerc 29(Suppl): S281, 1997
19. Weir JP, McDonough AL, Hill VJ. The effects of joint angle on electromyographic indices of fatigue. Eur J App Physiol 73: 387-392, 1996
20. Zedka M, Kumar S, Narayan Y. Comparison of surface EMG signals between electrode types, interelectrode distances and electrode orientations in isometric exercise of the erector spinae muscle. Electromyogr Clin Neurophysiol 37: 439-447, 1997
Address for correspondence:
Joseph P. Weir
Program In Physical Therapy
University of Osteopathic Medicine and Health Sciences
3200 Grand Avenue, Des Moines IA 50312
Phone: (515) 271-1733
FAX: (515) 271-1714
Email: jweir@uomhs.edu
American Society of Exercise Physiologists
All Rights Reserved