Effects
of nutritional supplementation during off-season college football training
on body composition and strength
RICHARD B. KREIDER2,
ROBERT C. KLESGES2,
DEAN LOTZ3, MIKE DAVIS3,
EDWARD CANTLER3, PAMELA
GRINDSTAFF1, LEIGH
RAMSEY1, DARYLL BULLEN1,
LARRY WOOD1,
ANTHONY L. ALMADA4
Exercise & Sport Nutrition
Laboratory1, Department of Human Movement Sciences & Education;
The Prevention Center2, Department of Psychology; Department
of Intercollegiate Athletics3 The University of Memphis, Memphis,
TN; and MetaResponse Sciences4, Aptos, CA
RICHARD B. KREIDER, ROBERT
C. KLESGES, DEAN LOTZ, MIKE DAVIS, EDWARD CANTLER, PAMELA GRINDSTAFF, LEIGH
RAMSEY, DARYLL BULLEN, LARRY WOOD, ANTHONY L. ALMADA. Effect
of nutritional supplementation during off-season college football training
on body composition and strength. JEPonline
Vol 2 No 2 1999.
Athletes often supplement their diet with meal-replacement/weight gain
powders in an attempt to increase muscle mass and strength. However,
it is unclear whether these supplements affect lean tissue accretion and/or
strength gains. This study evaluated whether supplementing the diet with
commercially available nutritional supplements during 84 days of winter
resistance/agility training and spring football practice affects body composition
and/or strength alterations. In a double blind and randomized manner,
51 college football players were matched and randomly assigned to supplement
their diet with either a carbohydrate placebo (P), a vitamin/mineral fortified
carbohydrate/protein supplement (Met-RxTM),
a vitamin/mineral fortified carbohydrate/protein powder containing 20 g/day
of creatine (PhosphagainTM),
or a vitamin/mineral fortified carbohydrate/protein powder containing 25
g/day of creatine (Phosphagain 2TM).
Additionally, a group of 10 subjects maintained normal dietary practices
during training and served as non-supplemented controls (NS). Total
body weight, total body water, DEXA determined body composition, and isotonic
strength tests were assessed on days 0, 35, and 84 of training. Results
revealed that mean gains in soft tissue/lean mass were significantly greater
in the PhosphagainTM
(P-I) and Phosphagain 2TM
(P-II) groups than changes in the NS, P, and Met-RxTM
(MRx) groups (NS 0.7±1.3; P 1.2±1.6; MRx 0.8±1.2;
P-I 2.3±1.4; P-II 3.4±1.8 kg). Mean gains in 1 RM bench
press in the MRx, P-I and P-II groups were significantly greater than gains
observed in the NS group (NS 2.0±9; P 7.6±7; MRx 9.8±6;
P-I 10.3±5; P-II 10.0±8 kg). Results indicate
that P-I and P-II supplementation during training promoted greater gains
in lean tissue mass in comparison to NS, P, and MRx groups and that gains
in strength in the supplemented groups were greater than the NS group.
Key Words:
SPORT NUTRITION, RESISTANCE-TRAINING, WEIGHT GAIN, CREATINE,
CARBOHYDRATE, PROTEIN, TAURINE, GLUTAMINE, RNA, MEAL-REPLACEMENT
Introduction
One of the more popular types of nutritional
supplements that athletes take are meal replacement/weight gain powders.
Most of these supplements are moderate to high calorie, vitamin and mineral
fortified, carbohydrate- protein powders containing various nutrients purported
to enhance lean tissue accretion during training (e.g., protein, amino
acids, chromium picolinate, creatine, etc.). Athletes often take
these supplements during hypertrophic resistance-training periods in order
to promote gains in fat free mass (FFM) and strength, and/or during intensified
training/competition periods in order to help maintain weight. Unfortunately,
little data are available regarding the effects of supplementing the diet
with various meal replacement/weight gain powders on body composition and
strength alterations during training.
We have previously reported (1)
on the effects of dietary supplementation with a commercially available
carbohydrate/protein supplement containing creatine monohydrate, taurine,
yeast-derived RNA, and L-glutamine (PhosphagainTM).
We demonstrated that 28 days of dietary supplementation, in combination
with resistance training, resulted in significantly greater gains in FFM
in comparison to a near-isocaloric non-fortified carbohydrate placebo and
a higher-calorie protein/carbohydrate supplement containing chromium picolinate
and boron (Gainers Fuel® 1000). These
findings indicated that formulation of a nutritional supplementation during
training may influence the change in body composition. Moreover,
PhosphagainTM supplementation during training
may be an effective nutritional strategy to promote gains in fat free mass.
However, it was clear that additional well-controlled research was necessary
to evaluate the effects of this nutritional formulation as well as other
popular meal replacement/weight gain powders on body composition and strength
alterations during training.
The purpose of this study was to determine
whether nutritional supplementation by collegiate football players would
alter body composition and muscular strength. Five groups of athletes
participated in the study. Three groups of collegiate football players
ingested commercial meal replacement/weight gain powders (Met-RxTTM,
PhosphagainTM, Phosphagain 2TM)
during two phases of off-season college football training (i.e., 35-d of
resistance/agility training and 49-d of resistance training/spring football
practice). Changes in FFM and muscular strength were compared to
athletes maintaining normal dietary practices, as well as athletes supplementing
their diet with a non-fortified carbohydrate placebo.
METHODS
Subjects
67 National Collegiate Athletic Association
(NCAA) division I-A football players undergoing off-season resistance/football
training at a major university in the mid-south region of the United States
volunteered to participated in this study. Subjects were informed
of the experimental procedures and signed informed consent statements in
adherence with the human subjects guidelines of the American College of
Sports Medicine and the Institutional Review Board at The University of
Memphis. 61 subjects who were descriptively (mean ± standard
deviations) 19.5±1.2 yrs, 99.5±19 kg, and 186±8 cm
completed the study. The remaining subjects were unable to complete the
study due to injury (2), quitting the team (1)
or they did not adequately comply to the protocol (3).
Subjects signed statements indicating that
they were not taking anabolic steroids, and that they were aware that they
were subject to random- unannounced drug testing during the study according
to NCAA regulations. While conducting the study, 29 athletes
were selected by the NCAA for random drug testing during two independent
screenings. All drug tests were negative for the presence of anabolic-androgenic
steroids according to NCAA criteria. In addition, there was no history
of athletes at this university testing positive for anabolic-androgenic
steroids in the previous 9 years of NCAA testing.
Experimental Design
Subjects participated in a 12-week off-season
training program consisting of two phases. The first phase of training
(35 days) consisted of 5 hr/wk of heavy resistance-training and 3 hr/wk
of agility/sprint training. The resistance-training program was conducted
on Monday, Tuesday, Thursday, and Friday afternoons, while the agility/sprint
training was conducted on Monday, Wednesday, and Friday mornings. Resistance
exercises included bench press, incline bench press, dumbbell incline bench
press, cable crossovers, shoulder shrugs, shoulder lateral raises, shoulder
press, neck exercises, seated dips, triceps extension, biceps curls, lat
pull downs, seated rows, back extension, abdominal crunches, bear squats,
split squats, isolateral leg press, leg extension, leg curl, calf raises,
and power cleans/pulls. These exercises were prescribed in a structured
periodized manner in weekly cycles. Each subject performed the same
exercise and number of repetitions for a given lift at a prescribed percentage
of the subjects one repetition maximum (1 RM). This was accomplished
by providing the athletes with individualized daily workout sheets which
described the lifts to perform, number of sets and repetitions, and pre-calculated
the amount of weight to lift based on the subjects 1RM for that lift.
Most exercises involved performing 2 - 4 sets of 4 - 10 repetitions at
60 to 90% of the athletes 1RM for a given lift. Resistance-training
sessions were supervised by strength coaches and student assistants/interns.
Athletes turned in completed training forms to the strength coaches at
the end of each resistance-training session to monitor progress. Agility
training consisted of a warm up for approximately 5 minutes (i.e., light
stretching/running) and then the completion of five 10-minute stations
of high intensity sprint, agility, and football drills under the direction
of assistant football coaches and strength coaches. Attendance at
resistance and agility training sessions was monitored and subjects who
missed workouts were required to make them up at early morning training
sessions typically within 48-h according to team policy. Since training
sessions were mandatory practices for these athletes, it was rare that
athletes missed training sessions.
The second phase of training began following
conducting phase I post assessments and included an abbreviated spring
break, spring football practice (which started during spring break), and
a week of post-testing following the completion of spring football practice.
During this period, subjects participated in a maintenance resistance-training
program twice per week (primarily lifts such as bench press, shoulder shrugs,
shoulder press, lat pull down, bear squats, leg press, etc.), spring football
practice (typically 2 to 3 h practices, 4 times per week for a total of
20 practices), sprint conditioning training (performed at the conclusion
of most practices), and team/position meetings. Phase II post-testing
was conducted in the week following the completion of spring football practice
(after 84 days of supplementation).
Subjects maintained their normal diet throughout
the study. Meals were provided to the athletes in their dormitory
three times per day at a team training table. Meals consisted of
ad
libitum intake of a primary entree and a limited number of side
entrees served at the team training table meals. Meals were prepared
according to a 7 day meal plan schedule, which designated what would be
served to the athletes for each meal. The same meal schedule was
repeated weekly throughout the study. Consequently, although the
athletes were allowed to select their own foods provided at the training
table and ingest food outside of the training table, dietary analysis revealed
that the diets of these athletes were very similar in regards to the type
of foods ingested each day. Subjects were not allowed to ingest
any other nutritional supplements, proposed ergogenic aids, or non-prescription
drugs during the course of the study. In addition, the subjects had
no history of taking creatine or creatine-containing products prior to
the start of supplementation.
During the first two weeks of the spring
semester, the athletes participated in training/study familiarization sessions.
This involved familiarizing the subjects to the resistance-training program
to be implemented, conducting familiarization sessions, and performing
pre-supplementation assessments. Pre-supplementation assessments
included: 1.) a 3 day nutritional intake assessment; 2.) measurement of
total body weight, total body water, and body composition; and 3.) 1 RM
and 70% of 1RM tests on the isotonic bench press.
Subjects recorded nutritional intake on
3 day dietary record forms with the assistance of research assistants who
had expertise in conducting nutritional analysis studies. This involved
having research assistants present at training table meals to ensure that
food intake was accurately recorded during these meals and that the subjects
recorded any food intake consumed between meals. Nutritional records
were analyzed by one experienced research assistant using the Food Processor
III nutritional analysis software (Nutritional Systems, Salem, OR).
Subjects were not allowed to exercise or
ingest food or drinks for 4 hours prior to body composition assessments.
Total body weight was measured on a calibrated digital scale with a precision
of ±0.02 kg (Sterling Scale Co., Southfield, MI). Total
body water was estimated (2) using a Valhalla 1990b Bioelectrical
Impedance Analyzer (San Diego, CA) using standard assessment criteria.
Whole body (excluding cranium) body composition measurements were determined
using a Hologic QDR-2000 dual energy x-ray absorptiometer (DEXA) with the
Hologic version V 7, REV F software (Waltham, MA). Subjects
were positioned according to standardized criteria during the initial scan.
This position was referenced into the computer for positioning of subjects
in subsequent trials. DEXA scans were performed primarily by one
certified radiology technician (177 of 183 scans) with the remaining scans
performed by another certified radiology technician following identical
positioning criteria.
DEXA measures the amount of bone, fat,
and fat-free/soft tissue mass which falls within standardized density ranges
using dual energy x-ray absorptiometry methodology. The DEXA scans
regions of the body (right arm, left arm, trunk, right leg, and left leg)
to determine the amount of bone mass, fat mass, and soft tissue lean mass
(STLM) within each region. The scanned bone, fat, and STLM for each
region are then subtotaled to determine whole body (excluding cranium)
values. Percent body fat is calculated by dividing the amount of
measured fat mass by total scanned mass (sum of bone mass, fat mass, and
fat-free/soft tissue mass). DEXA has been shown to be a highly reliable
(r = 0.99) and precise method (coefficient of variation of 0.5-1%) for
determining individual body composition segments (3-6).
Quality control calibration procedures
were performed on a spine phantom (Hologic X-CALIBER Model DPA/QDR-1 anthropometric
spine phantom) prior to each testing session following procedures previously
described (1,7, 8).
Mean coefficients of variation in BMC and BMD measurements obtained in
the lateral and array modes ranged between 0.41 to 0.55% throughout the
life of the unit. Test-retest reliability studies performed on male
athletes with this DEXA machine yielded mean deviation for total BMC and
total fat free/soft tissue mass of 0.31% with a mean intraclass correlation
of 0.985 (7).
Subjects performed a standardized 1RM isotonic
bench press test. This involved warming up and then performing 1
repetition lifts until reaching their 1RM maximum. Hand position
on the bar was recorded for standardization between trials. In addition,
subjects had to maintain good lifting form (i.e., feet maintaining contact
with the floor, no arching of the back off of the bench, no bouncing of
the weight off the chest). Once a 1 RM was determined on the bench
press, subjects rested for 5-min and then performed a maximum effort bench
press repetition test at 70% of 1RM. The number of repetitions
and 70% of 1RM weight were recorded. Total lifting volume was determined
by multiplying the number of repetitions performed by the amount of weight
lifted. Isotonic tests were performed in a competitive environment
under supervision of strength coaches and research assistants using standardized
lifting criteria.
Of the 61 subjects who participated in
this study, 51 subjects volunteered to ingest nutritional supplements during
training. These subjects were matched by FFM and team position and
assigned to supplement their diet in a double-blind and randomized manner
either: 195 g/day of a maltodextrin placebo (n = 11); MET-Rx®
(MET-Rx Substrate Technology, Inc.,Newport Beach, CA) containing
72 g/day carbohydrate, 111 g/day protein, 6 g/day fat and 9 g/day L-glutamine
(n = 13); Phosphagain® (Experimental & Applied Sciences,
Inc., Golden, CO) containing 57 g/day carbohydrate, 60 g/day protein,
5 g/day fat, 20 g/day of HPCE pure creatine monohydrate, 775 mg/day of
yeast-derived RNA, 7.2 g/day of L-glutamine, and 6.2 g/day of taurine (n=14);
or, Phosphagain 2® (Experimental & Applied Sciences,
Inc., Golden, CO) containing 39 g/day carbohydrate, 72 g/day protein,
6 g/day fat, 25.5 g/day of HPCE pure creatine monohydrate, 1,500 mg/day
of yeast-derived RNA, 9 g/day of L-glutamine, 10.5 g/day of taurine, and
6.75 g/day of calcium alpha-ketoglutarate (n = 13). In addition,
in a non-blinded and non-randomized manner, 10 athletes who did not want
to take nutritional supplements during training served as non-supplemented
controls. The FFM and team position of these athletes were similar
to the subjects ingesting nutritional supplements. Evaluation of
this control group allowed for the determination of the effects of training
on body composition and strength without nutritional intervention.
Table 1 describes the nutritional composition of the supplements.
Table 1. Ingredient list for the
placeo (P), Met-Rx (MRx), Phosphagain (P-I) and Phosphagain 2 (P-II) supplements
(Calculated from total daily servings).
Ingredient
P
MRx
PI
PII
Macronutrients
Carbohydrate (g)
195 72
57
39
Protein (g)
-
111
60
72
Fat (g)
-
6
5
5
Kilocalories (kcal)
780 786
513 489
Vitamins
Vitamin A (mcg RE)
- 2,700
1,050 1,200
Vitamin D (mcg)
- 11.7
9.75 9.75
Vitamin C (mg)
- 108
95
90
Vitamin E (mcg TE)
-
16.2
13.5 13.5
Vitamin K (mcg)
-
120
120 120
Thiamin (mg)
-
2.16
1.8 1.8
Riboflavin (mg)
-
2.5
2.1 2.1
Niacin (mg)
-
48
24
24
Vitamin B-6 (mg)
-
2.7
2.25 2.25
Vitamin B-12 (mcg)
-
3
3
3
Pantothenic Acid (mg)
-
6.6
8.25 8.25
Folic Acid (mcg)
-
270
270 270
Biotin (mcg)
-
108
90
90
Minerals
Sodium (mg)
- 1,170
1,170 1,200
Calcium (mg)
-
189 1,350
1,350
Magnesium (mg)
-
360
450 450
Potassium (mg)
-
2,250
1,500 2,190
Zinc (mg)
- 15.6
19.5 19.5
Manganese (mg)
-
3
3
3
Copper (mg)
-
0.2
3
3
Iron (mg)
- 14.4
18.0 7.2
Phosphorus (mg)
- 1,080
1,350 1,350
Iodine (mcg)
-
158
225 225
Selenium (mcg)
-
90
90 90
Chromium (mcg)
-
150
150 150
Molybdenum (mcg)
-
180
180 180
Other Nutrients
Creatine Monohydrate (g)
-
-
20 25.5
Taurine (g)
-
-
6.2 10.5
L-Glutamine (g)
-
9.0
7.2 9.0
RNA (mg)
-
-
775 1,500
Choline (mg)
-
-
240 240
Calcium alpha-ketoglutarate
-
-
- 6.75
Values are calculated based
on Reference Daily Intake (RDI) values for food label percent translations.
Supplements were prepared in powder form
and were flavored/colored by a flavor lab/packaging company to have near
identical texture, taste and appearance. Supplements were independently
packaged in generic foil packets for double-blind administration.
Subjects mixed the supplement powder into approximately 0.5 L of fluid
and ingested the solution with morning, mid-day and evening meals.
Subject compliance in taking the supplements was verified and recorded
by student athletic trainers at each meal attendance check-in throughout
the study.
Post-supplementation assessments were conducted
in a similar manner as pre-supplementation tests, following 35 and 84 days
of training and included: 1.) 3 day dietary records; 2.) measurement of
total body weight, total body water, and body composition; and 3.) tests
of 1 RM and 70% of 1RM isotonic bench press.
Statistical Analyses
Day 0 values were analyzed by one-way
analysis of variance (ANOVA) using SPSS for Windows version 8.0 software
to ensure that no significant differences were observed among groups in
pre-supplementation values. Since no significant differences were
observed in pre-supplementation variables, data were then analyzed using
general linear model repeated measures ANOVA with Tukey and LSD post-hoc
procedures. Interactions among groups were also examined by calculating
delta scores (subtracting day 0 values from day 35 and 84 values) and analyzing
them by ANOVA for repeated measures with Tukey and LSD post-hoc
procedures. During post-hoc analysis, significant differences were
observed in day 0 body weight, scanned mass and soft tissue/lean mass values
among groups. Although one-way ANOVA did not identify significant
differences among pre-supplementation values for these variables, these
data were analyzed by analysis of covariance (ANCOVA) using Day 0 values
as a covariate in order to verify that differences observed from the repeated
measures ANOVA were not due to differences among groups in pre supplementation
values. Data were considered significant when the probability for
Type I error was 0.05 or less. Data are presented as unadjusted
means ± standard deviations (SD).
RESULTS
Side Effects
Post-study questionnaires administered
in a double-blinded manner revealed that subjects tolerated the supplementation
protocol well with no reports of gastrointestinal distress and/or medical
problems/symptoms. In addition, there was no evidence of an increased
incidence of muscle injury and/or cramping noted by the athletic training
staff during spring football practice.
Nutritional Intake
No significant differences were observed
among groups in pre-supplementation mean estimated energy intake (NS
29.0±12; P 38.1±11;
MRx 38.0±7; P-I
36.3±12; P-II 38.2±14 kcal/kg/d, p = 0.68), carbohydrate
intake (NS 3.8±1.8; P 5.0±1.6; MRx 4.9±0.9;
P-I
5.2±2.3; P-II 4.9±2.2 g/kg/day, p = 0.74), fat
intake (NS 1.1±0.4;
P 1.4±0.5; MRx 1.4±0.4;
P-I 1.1±0.4;
P-II 1.4±0.5 g/kg/day, p = 0.39),
or protein intake (NS 1.2±0.6; P 1.6±0.4;
MRx
1.6±0.4; P-I
1.4±0.5; P-II 1.6±0.6
g/kg/day, p = 0.44). Supplementation did not significantly alter
mean energy intake (NS -3.8±9; P 4.1±11; MRx
2.9±9; P-I -0.8±7; P-II -2.8±7 kcal/kg/d,
p = 0.27) or fat intake (NS -0.1±0.2; P -0.1±0.6;
MRx
-0.1±0.3; P-I 0.1±0.3; P-II -0.2±0.3
g/kg/day, p = 0.59) from pre supplementation values. However, mean
carbohydrate intake in the P group was significantly increased (NS -0.6±1.4;
P
1.2±1.3; MRx -0.2±1.4;
P-I -0.9±1.5;
P-II
-0.7±1.3 g/kg/day, p = 0.004) while mean protein intake in the
MRx, P-I and P-II groups was significantly increased (NS -0.2±0.5;
P
-0.2±0.5; MRx
0.9±0.5; P-I 0.5±0.3;
P-II
0.4±0.3 g/kg/day, p = 0.001).
Total Body Weight and Water.
Table 2 presents mean changes in total
body weight and body water for the NS, P, MRx, P-I and P-II groups.
Repeated measures ANOVA revealed a significant interaction (p = 0.001)
among groups in total body weight. Post-hoc analysis revealed that
total body weight was significantly increased in the P-I and P-II groups
after 35-d and 84-d of training. In addition, gains in body weight
in the P-I and P-II groups after 35 and 84 days of training, respectively,
were significantly greater than changes observed in the NS group (NS
-1.6 ±1.6, -1.9±2.0; P 0.6±2.1, 0.8±2.9;
MRx
0.03±1.7, 0.7±2.0;
P-I 1 .9±2.6, 2.5±4.2;
P-II 2.6±2.5, 2.4±2.7 kg). Since
post-hoc
analysis revealed differences among day 0 total body weight means, ANCOVA
was performed on body weight data analysis using day 0 values as the covariate.
ANCOVA analysis confirmed that the mean weight gain observed in the P-I
and P-II groups was significantly greater (p = 0.001) than the NS and MRx
groups (NS -1.7±1.6; P 0.7±2.4;
MRx
0.3±1.6;
P-I 2.2±3.3; P-II 2.5±2.4 kg).
No significant differences were observed among groups in changes in total
body water expressed as a percentage of total body weight (NS 0.8±2.2,
-0.1±1.8;
P 0.7±1.9, 0.4±1.9;
MRx -0.05±1.7,
-0.12±1.8;
P-I 1.0±1.4, 0.02±1.7; P-II
0.9±1.4, -0.3±1.2 %).
Table 2. Body weight and BIA determined
body water data for the non-supplemented (NS), carbohydrate placebo (P),
Met-Rx (MRx), Phosphagain (P-I), and Phosphagain 2 (P-II) groups.
Variable
Group Day 0
Day 35 Day 84
Factor p-value
Body
Group 0.81
weight
Time 0.02
(kg)
Gp x Ti 0.006
NS 106.1±19.1
104.5±18.0 104.3±18.0
*^£
*^£
*^
P
96.7±19.2 97.3±18.2
97.5±18.0
£
^£
^£
MRx 96.3±17.1
96.4±17.7 97.0±17.5
^£
^£
^£
P-I 98.7±18.3
100.6±18.9 101.2±18.0
£
*£ø
*^£ø
P-II 100.8±22.1
103.4±21.9 103.2±21.2
*^
*^ø
*^ø
Total
Group 0.07
Body
Time
0.94
Water (%)
Gp x Ti 0.90
NS 60.3±3.0
61.1±1.9 60.3±2.3
P 62.6±2.4
63.3±2.4 63.0±2.9
MRx 63.4±1.7
63.3±2.1 63.2±2.4
P-I 62.0±2.6
63.0±2.4 62.1±2.7
P-II 61.6±2.9
62.5±3.2 61.3±2.9
Data are unadjusted group
means±SD. p <0.05 from NS, * p <0.05 from P, p <0.05
from MRx, ^ p <0.05 from P-I, £ p <0.05 from P-II, ø
p <0.05 from Pre(day 0).
Body Composition
Table 3 presents DEXA determined body
composition data obtained on days 0, 35 and 84 of training while Figures
1 to 4 present DEXA results expressed as mean changes in body composition
values from days 0 to 35 and 0 to 84. A significant interaction (p<0.001)
was observed among groups in scanned body mass. Post-hoc analysis
revealed that scanned body mass was significantly increased from Day 0
values in the P-II group following 35 and 84 days of supplementation. Analysis
of delta values revealed that changes in scanned mass in the P-I group
were significantly greater (p=0.001) than the NS group following 35 and
84 days of training. In addition, the gains in scanned mass in the
P-II group were significantly greater than the NS, P, and MRx groups following
35-d and 84-d of training (NS -1.0 ±1.2, -1.7±1.6;
P
0.8±2.4, 0.8±2.9; MRx 0.3±1.6, 0.6±1.8;
P-I
1.7±2.1,
1.6±3.6; P-II 3.1±2.6, 2.9±2.7 kg for days
35 and 84, respectively). Since
post-hoc analysis revealed
significant differences among day 0 scanned mass, ANCOVA was performed
using day 0 values as the covariate. ANCOVA analysis confirmed that
mean changes in scanned mass in the P-I group was significantly greater
(p = 0.001) than the NS group and changes observed in the P-II group were
significantly greater than the NS, MRx, and P groups (NS -1.4±1.3;
P
0.8±2.5; MRx 0.4±1.5;
P-I 1.7±2.7;
P-II
3.0±2.5 kg).
Repeated measures ANOVA also revealed a
significant interaction (p = 0.001) in STLM values. Post-hoc analysis
revealed that STLM was significantly increased in the P-I and P-II groups
following 35 and 84-d of training. Analysis of delta values revealed
that mean gains in STLM observed in the P-I and P-II groups were significantly
greater than changes in the NS, P, and MRx groups following 35 days of
training. However, following 84-d of training, gains in STLM in the
P-I group were only significantly greater (p = 0.001) than the NS group
while gains observed in the P-II group were significantly greater than
the NS, P, MRx, and P-I groups (NS 0.7 ±1.8, 0.7±1.8;
P
1.2±1.6, 1.1±1.6; MRx 0.5±1.2, 1.1±1.5;
P-I
2.5±1.3, 2.1±1.9; P-II 3.5±1.9, 3.4±1.9
kg for days 35 and 84, respectively). ANCOVA confirmed that mean
changes in STLM in the P-I group were significantly greater (p = 0.001)
than the NS and MRx groups while mean changes in the P-II group were significantly
greater than the NS, P, and MRx groups (NS 0.7±1.3;
P
1.2±1.6;
MRx 0.8±1.2; P-I 2.3±1.4;
P-II
3.4±1.8 kg). No significant differences were observed among
groups in DEXA determined bone mass (p = 0.66). There was some evidence
that fat mass (p = 0.07) and percent body fat (p = 0.11) decreased to a
greater degree in the NS group.
Table 3. DEXA body composition data
for the non-supplemented (NS), carbohydrate placebo (P), Met-Rx (MRx),
Phosphagain (P-I), and Phosphagain 2 (P-II) groups.
Variable
Group Day 0
Day 35 Day 84
Factor p-value
Scanned Mass (kg)
Group 0.07
Time 0.001
Gp x Ti 0.001
NS 99.3±18.1
98.3±17.7 97.6±17.6
*^£
*^
*^
P
89.7±18.3 90.5±17.2
90.5±17.0
^£
^£
^£
MRx 89.5±16.7
89.7±16.8 90.1±16.5
^£
^£
^£
P-I 92.5±17.9
94.2±18.2 94.1±17.1
*
*£
*£
P-II 93.5±21.1
96.6±21.0 96.4±20.4
*
*^ø
*^ø
Soft Tissue Lean Mass (kg)
Group 0.86
Time 0.001
Gp x Ti 0.001
NS 71.1±8.6£
71.8±9.4£ 71.8±9.7£
P 71.4±8.8
72.6±8.2£ 72.6±8.0£
MRx 72.0±9.4
72.6±9.4£ 73.2±9.9£
P-I 73.2±9.3
75.7±9.3 75.2±8.9
*ø
*ø
P-II 72.4±8.7
75.8±8.2 75.7±8.2
*ø
*ø
Fat Mass (kg)
Group 0.29
Time 0.001
Gp x Ti 0.001
NS 25.1±11.1
23.4±11.5 22.6±11.1
P 15.2±11.1
14.8±10.8 14.8±10.9
MRx 14.1±9.9
13.9±10.2 13.6±10.1
P-I 16.1±10.7
15.3±10.4 15.7±9.9
P-II 17.8±13.3
17.4±13.4 17.2±13.1
Bone Mass (g)
Group 0.61
Time 0.06
Gp x Ti 0.66
NS 3,214±453
3,242±488 3,251±478
P 3,100±369
3,141±361 3,124±340
MRx 3,355±542
3,380±548 3,375±588
P-I 3,221±499
3,207±468 3,213±448
P-II 3,339±475
3,398±476 3,418±476
Body Fat (%)
Group 0.10
Time 0.001
Gp x Ti 0.11
NS 24.5±7.0
23.0±7.4
22.4±7.4
P 15.5±8.7
15.0±8.6
15.1±8.7
MRx 14.7±7.9
14.4±8.0
14.1±8.1
P-I 16.2±8.4
15.0±7.9
15.5±7.8
P-II 17.2±9.3
16.2±9.2
16.2±9.0
Data are unadjusted group
means?SD. p <0.05 from NS, * p <0.05 from P, p <0.05 from
MRx, ^ p <0.05 from P-I, £ p <0.05 from P-II, ø
p <0.05 from Pre(day 0).
Strength
Table 4 presents results for the 1 RM
bench press test and 70% of 1RM bench press repetition tests performed
on day 0, 35, and 84 of training. ANOVA for repeated measures revealed
no significant interactions in 1RM bench press (p = 0.10), the number of
repetitions performed at 70% of 1 RM (p = 0.34), or total lifting volume
(p = 0.49). However, mean change analysis revealed that gains in
1 RM bench press in the MRx, P-I and P-II groups were significantly greater
(p=0.04) than gains observed in the NS group (NS 2.0±9; P
7.6±7;
MRx
9.8±6; P-I 10.3±5; P-II
10.0±8 kg). No significant differences were observed among
supplemented groups.
Table 4. Strength data for the non-supplemented
(NS), carbohydrate placebo (P), Met-Rx (MRx), Phosphagain (P-I), and
Phosphagain 2 (P-II) groups.
Variable
Group Day 0
Day 35 Day 84
Factor p-value
1 RM Bench Press (kg)
Group 0.49
Time 0.001
Gp x Ti 0.10
NS
136.4±23 141.6±24
135.2±16
P
125.9±25 134.9±27
132.1±23
MRx 129.9±25
139.5±25 139.9±23
P-I
138.7±21 150.5±21
147.5±21
P-II
136.9±24 148.8±22
145.0±18
Repetitions (70% 1 RM)
Group 0.59
Time 0.001
Gp x Ti 0.34
NS
14.8±3.5 11.9± 3.5
13.2±2.9
P
12.5±2.2 11.6± 1.7
12.8±2.7
MRx 14.8±4.0
11.7±4.2 12.8±2.6
P-I
14.6±3.6 13.1± 2.8
13.9±2.9
P-II
13.2±3.1 12.4± 2.3
14.2±2.7
Lifting Volume (kg)
Group 0.29
Time 0.04
Gp x Ti 0.49
NS
1,410±427 1,140± 299
1,334±256
P
1,110±337 1,106± 312
1,186±362
MRx 1,349±434
1,174±509 1,253±293
P-I
1,409±390 1,356± 223
1,412±301
P-II
1,282±387 1,285± 281
1,411±338
Data are unadjusted group
means±SD
DISCUSSION
Results from the present study indicate
that: 1.) supplementing the diet with P-I and P-II during the first 5-wks
of off-season football resistance/agility training resulted in significantly
greater gains in the scanned total lean mass in comparison to the NS, P,
and/or MRx groups; 2.) the changes in STLM during phase II of training
were minimal; and 3.) gains in 1 RM bench press strength in the P, MRx,
P-I and P-II groups were significantly greater than gains observed in the
NS groups. These findings suggest that dietary supplementation during
off-season football training may affect lean tissue accretion in varying
degrees depending on the specific nutritional formulation ingested and
the type of training employed. While the etiology of these findings
remain to be determined, results indicate that P-I and P-II supplementation
during training may be effective in promoting lean tissue accretion during
off-season college football training. The following discussion
provides greater insight into the alterations in body composition and strength
observed.
Body Composition
There are several interesting findings
observed in the present study regarding body composition changes during
training. First, the gains in STLM and total body weight observed
were not associated with significant increases in fat mass. In this
regard, Forbes and associates (9) reported that an average
of 0.5 kg of FFM is gained or lost with each 1kg change in total body mass
during training. Since 4 to 8 weeks of resistance training typically
promotes a 0.5 to 1.0 kg increase in FFM (10), one would
expect that the hypertrophic resistance/agility phase of training would
increase body mass with proportional increases in STLM and fat mass.
In the present study, subjects in the NS group lost -1.0±1.2 kg
of scanned body mass during Phase I of training. Consequently, based
on previous findings, it would be expected that STLM and fat mass would
have decreased. However, while fat mass decreased (-1.8±1.8
kg), STLM increased (0.7±1.8 kg) resulting in 1.6±1.7 % reduction
in body fat percent. During Phase II of training, overall gains in
STLM mass were maintained (0.7±1.8 kg) while scanned mass (-1.7±1.6
kg), fat mass (-2.5±1.6 kg) and body fat percent (-2.2±1.6
%) continued to decrease from pre-supplementation levels. These findings
suggest that athletes undergoing off-season football training may be able
to increase STLM and lose fat mass despite losses in total body weight.
Moreover, positive body composition alterations (i.e, gains in STLM and
loss in fat mass) can be achieved during off-season football training without
nutritional intervention.
One of the theoretical goals of nutritional
supplementation during training is to promote greater gains in FFM during
hypertrophic training phases and/or serve to maintain FFM during intense
training periods. General nutritional recommendations for promoting
weight gain/lean tissue accretion during training include increasing caloric
intake by 500 - 1,000 kcal/day through eating 5 to 6 well-balance meals/day
and/or supplementing the diet with carbohydrate and/or nutrient fortified
carbohydrate/protein powders in order to increase caloric intake.
Studies which have evaluated the effects of increasing caloric intake on
body composition indicate that this nutritional strategy is effective in
increasing total body mass (1,11).
However, only 30-50% of the mass gain is typically fat free mass (1,11).
For athletes, gaining fat mass may not be a desirable alteration in body
composition. Consequently, researchers have been looking for nutritional
strategies to promote lean tissue accretion during training without excessive
gains in fat mass.
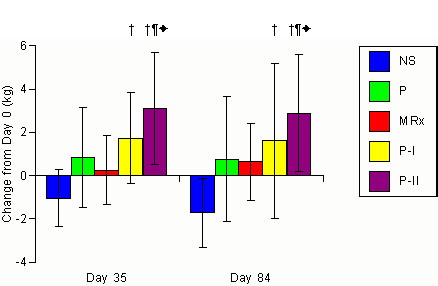
Figure 1. Changes
in DEXA determined scanned body mass for the non-supplemented (NS), carbohydrate
placebo (P), Met-Rx (MRx), Phosphagain (P-I), and Phosphagain 2 (P-II)
groups after 35-d and 84-d of supplementation. Data are means and
± standard deviations. represents p<0.05 difference from
the non-supplemented group. * represents p<0.05 difference from
placebo group. + represents p<0.05 difference from MRx group.
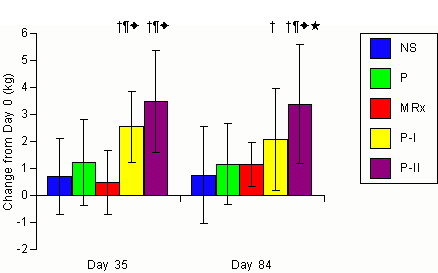
Figure 2. Changes
in DEXA determined soft tissue/lean mass for the non-supplemented (NS),
carbohydrate placebo (P), Met-Rx (MRx), Phosphagain (P-I), and Phosphagain
2 (P-II) groups after 35-d and 84-d of supplementation. Data are
means and ± standard deviations. represents p<0.05 difference
from the non-supplemented group. * represents p<0.05 difference
from placebo group. represents p<0.05 difference from MRx
group. represents p<0.05 difference from P-I group.
In the present study, dietary supplementation
of P, MRx, P-I, and P-II did not significantly increase total energy intake.
However, carbohydrate intake was increased in the P group while protein
intake was increased in the MRx, P-I and P-II groups. These findings
suggests that the supplementation strategies employed were effective in
altering macro- and/or micro-nutrient intake but that the athletes altered
dietary patterns to essentially maintain total energy intake. Whether this
was due to the supplements altering appetite and/or normal dietary adaptations
to training is unclear. Nevertheless, it is clear that if the nutritional
supplementation strategies employed promoted greater gains in lean tissue
accretion during training than observed in the NS group, gains in STLM
could not simply be attributed to increased caloric intake but rather alterations
in macro- and/or micro-nutrient intake.
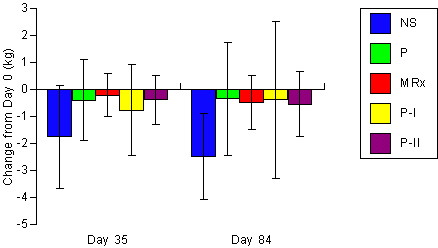
Figure 3. Changes
in DEXA determined fat mass for the non-supplemented (NS), carbohydrate
placebo (P), Met-Rx (MRx), Phosphagain (P-I), and Phosphagain 2 (P-II)
groups after 35-d and 84-d of supplementation. Data are means ±
SD.
If these nutritional strategies are effective
in promoting lean tissue accretion during training, one would expect that
subjects supplementing their diet with carbohydrate (P group) would promote
significantly greater gains in STLM in comparison to athletes training
while maintaining normal dietary practices (NS group). Further, supplementing
the diet with fortified carbohydrate/protein powders containing nutrients
purported to promote lean tissue accretion (i.e., MRx, P-I and P-II groups)
would promote greater gains in STLM than the NS and P groups. Interestingly,
increasing dietary availability of carbohydrate (P group) and protein (MRx
group) during training did not result in significantly greater gains in
STLM in comparison to the NS group. However, there was evidence
that P-I and P-II supplementation during training promoted greater gains
in STLM in comparison to the NS, P, and MRx groups.
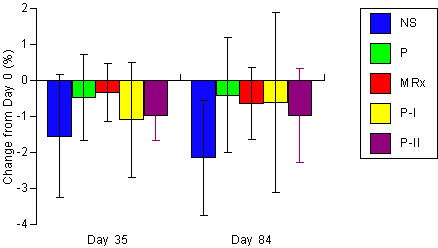
Figure 4. Changes
in DEXA determined body fat for the non-supplemented (NS), carbohydrate
placebo (P), Met-Rx (MRx), Phosphagain (P-I), and Phosphagain 2 (P-II)
groups after 35-d and 84-d of supplementation. Data are means ±
SD.
While the etiology of the greater increases
in STLM observed in the P-I and P-II are unclear, there are several points
that should be noted. First, gains in STLM observed during the hypertrophic
resistance-training phase in the NS (0.7±1.4 kg), P (1.2±1.6
kg), and MRx (0.5±1.2 kg) groups were typical of gains previously
reported in response to 4 to 8 weeks of resistance-training (10).
Second, no significant differences were observed among these groups in
gains in STLM. These findings suggest that supplementing the diet
with carbohydrate and the popular vitamin and mineral fortified carbohydrate/
protein meal replacement powder Met-Rx did not promote significantly greater
gains in STLM during training than subjects maintaining normal dietary
practices. Third, gains in STLM in the P-I group following Phase
I of training (2.5±1.3 kg) were 1.1 to 4 times greater than the
gains observed in the NS, P, and MRx groups. Furthermore, the overall
gains in STLM in the P-I group (2.1±1.9 kg) were 0.9 to 2 times
greater than the NS (0.7±1.8 kg), P (1.1±1.6 kg), and MRx
(1.1±1.5 kg) groups following 84 days of training. These gains
could not be explained by a disproportionate increase in total body water,
greater caloric intake, or differences among groups in training energy
expenditure. Moreover, fat mass was slightly decreased throughout
the training period (-0.4±2.9 kg). Consequently, P-I supplementation
during training was effective in promoting greater gains in STLM without
gains in fat mass.
While it is unclear which individual or
combination of nutrients was responsible for the gains in STLM observed,
the theoretically active nutrients include creatine monohydrate, taurine,
yeast-derived RNA, and L-glutamine. Creatine supplementation ( 20
g/d for 5 to 28 days) has been reported to increase intramuscular total
creatine content (12-18) and increase body mass and/or
fat free mass (1,8, 12,19-28)
possibly due to fluid retention (13,29)
and/or enhanced skeletal muscle protein synthesis (27, 30).
Studies indicate that long-term supplementation (> 7-d) of creatine alone
(8,12, 19-21,
25-27),
creatine with glucose (8,24, 25),
and creatine with carbohydrate/protein powders (1) promote
significantly greater gains in body mass and/or fat free mass in comparison
to placebo controls. The amino acid taurine is the second most
abundant free amino acid in human skeletal muscle, compartmentalized primarily
in type I muscle fibers (31). There is evidence
from animal studies that taurine may potentiate the actions of insulin
(32, 33). Nucleotides (liberated
from RNA) serve as precursors in nucleic acid synthesis, participate in
energy transfer reactions, and function as coenzymes (34).
Finally, glutamine has been reported to be important in modulating cellular
hydration/volume (35) and regulating protein synthesis
in skeletal muscle (36, 37).
While additional study is necessary to examine the potential additive and/or
synergistic interactions that nutrients contained in the P-I formulation
may have on lean tissue accretion, present data support our initial findings
(1) that this nutritional formulation may serve as an
effective means of promoting lean tissue accretion during resistance-training.
Fourth, the primary difference between
the P-I and P-II formulations was that P-II contained less carbohydrate
(18 g.d-1) and had an additional 12 g/day
of protein, 5.5 g/day of HPCE pure creatine monohydrate, 725 mg/day of
yeast-derived RNA, 1.8 g/day of L-glutamine, 3.2 g/day of taurine, and
6.75 g/day of calcium alpha-ketoglutarate. Dietary availability of
calcium has been reported to positively affect fat free mass (7).
Moreover, if the theoretically active nutrients described above and/or
calcium alpha-ketoglutarate affect lean tissue accretion, one would
expect greater gains in STLM in the P-II supplemented group. Results
revealed that the gains in STLM observed in the P-II supplemented group
following Phase I of training (3.5±1.9 kg) were 2.9 to 7 times greater
than observed in the NS, P, and MRx groups and non-significantly greater
(40%) than the P-I group. Further, that gains in STLM in the P-II
group following 84-d of supplementation (3.4±2.2 kg) were 3.1 to
4.9 times greater than the NS, P, and MRx groups and significantly greater
(67%) than the P-I group. Once again, these gains could not be explained
by disproportionate increases in total body water, greater caloric intake,
and/or differences among groups in training energy expenditure. Moreover,
they occurred despite a -0.6±1.2 kg decrease in fat mass.
While it is unclear which nutrient or combination of nutrients may have
promoted the additional gains in STLM, results suggest that this nutritional
formulation may be particularly effective in promoting lean tissue accretion
during training.
Strength
Resistance-training typically promotes
gains in muscular strength through a combination of neural adaptations
and muscle hypertrophy (10). Results of the present
study indicate that mean gains in 1RM bench press in the MRx, P-I and P-II
groups were significantly greater than gains observed in the NS group (NS
2.0±9; P 7.6±7; MRx 9.8±6; P-I
10.3±5; P-II 10.0±8 kg). However, no significant
differences were observed among the P, MRx, P-I and P-II groups.
These findings suggest that subjects supplementing their diet with MRx,
P-I and P-II promoted greater gains in upper extremity strength than subjects
maintaining normal dietary practices during training. Interestingly,
P-I and P-II supplementation (which contain 20 and 25 g/day of creatine
monohydrate, respectively) did not promote significantly greater gains
in 1 RM strength in comparison to supplementing the diet with carbohydrate
or MRx despite significant gains in STLM. These findings appear
to contrast reports that creatine supplementation during training may increase
gains in 1RM strength (8, 17, 20-23,25,26,
38). Moreover, no significant differences were observed
in the number of repetitions performed at 70% of 1RM or total lifting volume
among groups. These findings contrast previous reports that supplementing
the diet with creatine may increase muscular endurance (8,
12,17,21, 26,
39). This may be due, in part, to the manner in which
the 70% of 1RM tests were conducted. In this regard, subjects lifted
70% of their new 1RM following 35-d and 84-d rather than being retested
on lifting 70% of their pre-supplementation 1RM. Consequently, muscle
endurance at a given percentage of 1RM could be assessed while controlling
for changes in 1RM strength. Nevertheless, results indicated that
gains in 1RM strength in the MRx, P-I and P-II groups were significantly
greater than gains in the NS group but that there were no differences in
muscular endurance when lifting 70% of their new 1RM. Additional
research should investigate the effects of ingesting creatine-containing
supplements on alterations in strength during training.
SUMMARY
Results of this study indicate that subjects
supplementing their diet with P-I and P-II during off-season college football
training had significantly greater gains in STLM in comparison to subjects
maintaining a normal diet or supplementing their diet with near isocaloric
amounts of a carbohydrate placebo or a popular meal replacement powder.
Furthermore, gains in 1RM strength in the MRx, P-I, and P-II supplemented
groups were significantly greater than gains in the NS group. Gains
in STLM and strength were primarily observed during phase I of resistance/agility
training while these measurements were essentially maintained during phase
II of training/spring football practice. These findings could not be explained
by differences among groups in percentage of total body water, caloric
intake, and/or differences in energy expenditure. While additional
research is necessary to examine potential additive and/or synergistic
interactions that nutrients contained in the P-I and P-II formulations
may have on lean tissue accretion during resistance-training, results indicate
that these nutritional formulations may serve as effective nutritional
strategies in enhancing lean tissue accretion particularly during intense
periods of resistance/agility training.
References
1. Kreider
RB, Klesges R, Harmon K, Grindstaff P, Ramsey L, Bullen D, Wood L, Li Y,
Almada A. Effects of ingesting supplements designed to promote lean
tissue accretion on body composition during resistance-training.
Int J Sport Nutr 1996; 6:234-246.
2. Van
Loan MD. Bioelectrical impedance analysis to determine fat-free mass,
total body water and body fat. Sports Med 1990; 10:205-217.
3. Fuller
NJ, Jebb SA, Laskey MA, Coward WA, Elia M. Four-compartment model
for assessment of body composition in humans: comparison with alternative
methods and evaluation of the density and hydration of fat-free mass.
Clin Sci 1992; 82:687-693.
4. Horber
FF, Thomi F, Casez HP, Fonteielle J, Jaeger P. Impact of hydration
status on body composition as measured by dual energy X-ray absorptiometry
in normal volunteers and patients on haemodialysis. Br J Radiol
1992; 65:895-900.
5. Kellie
EE. Measurement of bone density with dual-energy x-ray absorptiometry
(DEXA). JAMA 1992; 267:286-294.
6. Mazess
RB, Barden HS, Biseck JP, Hanson J. Dual-energy x-ray absorptiometry
for total-body and regional bone-mineral and soft-tissue composition.
Am J Clin Nutr 1990; 51:1106-1112.
7. Klesges
RC, Ward KD, Shelton ML, Applegate WB, Cantler ED, Palmeiri GMA, Harmon
K, Davis J. Changes in bone mineral content in male athletes:
Mechanisms of action and intervention effects. JAMA.
1996; 276:226-230.
8. Kreider
R, Ferreira M, Wilson M, Grindstaff P, Plisk S, Reinhardy J, Cantler E,
Almada A. Effects of creatine supplementation on body composition,
strength and sprint performance. Med Sci Sport Exerc
1998; 30:73-82.
9.
Forbes GB. Exercise and body composition. J Appl Physiol.
1991; 70:994-997.
10. Kraemer
WJ. General adaptations to resistance and endurance training.
In: Baechle T (Ed.). Essentials of Strength Training and Conditioning.
Champaign, IL: Human Kinetics, 1994: 127-150.
11. Forbes
GB, Brown MR, Welle SL, Lipinski BA. Deliberate overfeeding in women
and men: energy cost and composition of weight gain. Br J Nutr
1986; 56:1-9.
12. Balsom
PD, Ekblom B, Söderlund K, Sjödin B, Hultman E. Creatine
supplementation and dynamic high-intensity intermittent exercise.
Scand
J Med Sci Sports
1993; 3:143-49.
13. Balsom
PD, Söderlund K, Ekblom B. Creatine in humans with special reference
to creatine supplementation. Sports Med 1994; 18:268-280.
14. Balsom
PD, Söderlund K, Sjödin B, Ekblom B. Skeletal muscle metabolism
during short duration high-intensity exercise: influence of creatine supplementation.
Acta Physiol Scand 1995; 1154:303-310.
15. Bessman
SP, Savabi F. The role of the phosphocreatine energy shuttle in exercise
and muscle hypertrophy. In: Taylor AW, Gollnick PD, Green HJ
(Eds.) International series on sport sciences: Biochemistry of exercise
VII: Champaign, IL: Human Kinetics, 1988: Vol. 21: 167-178.
16. Chanutin
A. The fate of creatine when administered to man. J Biol
Chem 1926; 67:29-41.
17. Greenhaff
PL, Casey A, Short AH, Harris R, Soderlund K, Hultman E. Influence
of oral creatine supplementation of muscle torque during repeated bouts
of maximal voluntary exercise in man. Clin Sci
1993; 84:565-571.
18. Harris
RC, Söderlund K, Hultman E. Elevation of creatine in resting
and exercised muscle of normal subjects by creatine supplementation. Clin
Sci 1992; 83:367-74.
19. Balsom
PD, Harridge SDR, Söderlund K, Sjödin B, Hultman E. Creatine
supplementation per se does not enhance endurance exercise performance.
Acta Physiol Scand 1993; 149:521-23.
20. Becque
BD, Lochmann JD, Melrose D. Effect of creatine supplementation during
strength training on 1 RM and body composition. Med Sci Sport
Exerc 1997; 29:S146.
21. Earnest
CP, Snell PG, Rodriguez R, Almada AL, Mitchell TL. The effect of
creatine monohydrate ingestion on anaerobic power indices, muscular strength
and body composition. Acta Physiol Scand 1995; 153:207-9.
22. Goldberg
PG, Bechtel PJ. Effects of low dose creatine supplementation on strength,
speed and power by male athletes. Med Sci Sport Exerc
1997; 29:S251.
23. Kirksey
KB, Warren BJ, Stone MH, Stone MR, Johnson RL. The effects of six
weeks of creatine monohydrate supplementation in male and female track
athletes. Med Sci Sport Exerc 1997; 29:S145.
24. Kreider
R, Ferreira M, Wilson M, Almada A. Effects of creatine supplementation
with and without glucose on body composition in trained and untrained men
and women. J Strength Cond Res 1997; 11:283.
25. Stout
JR, Eckerson J, Noonan D, Moore G, Cullen D. The effects of a supplement
designed to augment creatine uptake on exercise performance and fat-free
mass in football players. Med Sci Sport Exerc 1997;
29:S251.
26. Volek
JS, Kraemer WJ, Bush JA, Boetes M, Incledon T, Clark KL, Lynch JM.
Creatine supplementation enhances muscular performance during high-intensity
resistance exercise. J Am Diet Assoc 97:765-770, 1997.
27. Ziegenfuss
TN, Lemon PWR, Rogers MR, Ross R, Yarasheski KE. Acute creatine ingestion:
effects on muscle volume, anaerobic power, fluid volumes, and protein turnover.
Med Sci Sports Excer 1997; 29:S127.
28. Vanderberghe
K, Goris M, Van Hecke P, Van Leeputte M, Vangerven L, Hespel P. Long-term
creatine intake is beneficial to muscle performance during resistance-training.
J Appl Physiol 1997; 83:2055-63.
29. Ziegunfuss
TN, Lowery LM, Lemon PWR, Rogers M, Ross R, Yarasheski K. Acute fluid
volume changes in men during three days of creatine supplementation.
JEPonline1998;
1(3) Available: http://www.asep.org/asep/asep/jan13d.htm
30. Ingwall
JS. Creatine and the control of muscle-specific protein synthesis
in cardiac and skeletal muscle. Circ Res 1976; 38(Suppl.
1):I115-I123.
31. Kendler
BS. Taurine: an overview of its role in preventive medicine.
Prev Med 1989; 18:79-100.
32. Kulakowski
EC, Maturo J. Hypoglycemic effects of taurine: not mediated by enhanced
insulin release. Biochem Pharmacol 1984; 33:2835-2838.
33. Lampson
WG, Kramer JH, Schaffer SW. Potentiation of the actions of insulin
by taurine. Can J Physiol Pharmacol 1983; 61:457-463.
34. Corey
J. Purine and pyrimidine nucleotide metabolism. In: Devlin
TM (Ed.) Textbook of Biochemistry. New York, NY: Wiley;
1982: 628-80.
35. Haussinger
D. Regulation of metabolism by changes in cellular hydration.
Clin
Nutr 1995; 14:4-12.
36. Hammarqvist
F, Wernerman J, Ali R, von der Decken A, Vinnars E. Addition of glutamine
to total parenteral nutrition after elective abdominal surgery spares free
glutamine in muscle, counteracts the fall in protein synthesis, and improves
nitrogen balance.
Ann Surg 1989; 209:455-461.
37. MacLennen
PA, Brown RA, Rennie MJ. A positive relationship between protein
synthesis rate and intracellular glutamine concentration in perfused rat
skeletal muscle. FEBS Lett. 1987; 215:187-191.
38. Johnson
KD, Smodic B, Hill R. The effects of creatine monohydrate supplementation
on muscular power and work. Med Sci Sport Exerc 1997; 29:S251.
39. Grindstaff
PD, Kreider RB, Bishop R, Wilson M, Wood L, Alexander C, Almada AL.
Effects of creatine supplementation on repetitive sprint performance and
body composition in competitive swimmers. Int J Sport Nutr
1997; 7:330-46.
Address
For Correspondence:
Richard
B. Kreider, PhD, FACSM, Exercise & Sport Nutrition Laboratory,
Department of Human Movement Sciences & Education, The University of
Memphis Memphis, TN 38152, Phone: 901/678-3474, Fax: 901/678-3591
Acknowledgments:
We would like to thank the subjects who participated in this study and
the laboratory assistants in Exercise & Sport Sciences Laboratory,
the Universities Prevention Center, and in the Department of Athletics
at The University of Memphis who assisted in data acquisition and analysis.
The authors would also like to thank Maria Ferreira, MS, RD, CSCS for her
contribution to this paper. This study was funded through a research grant
provided to The University of Memphis from Experimental and Applied Sciences,
Golden, CO. Investigators from The University of Memphis independently
collected, analyzed and interpreted data from this study and have no financial
interest in the outcome of results reported. A.L. Almada is cofounder
and a consultant for Experimental and Applied Sciences, Inc. and served
as a consultant and liaison between investigators at The University of
Memphis and the granting agency. Presentation of results in this
study does not constitute endorsement of the products investigated by The
University of Memphis.
Copyright ©1999
American
Society of Exercise Physiologists
All Rights Reserved