JEPonline
Journal
of
Exercise
Physiologyonline
Official
Journal of the American
Society
of Exercise Physiologists (ASEP)
ISSN
1097-9751
An
International Electronic Journal
Volume
3 Number 2 April 2000
Metabolic
Responses to Exercise
The Precision
of Extimating the Total Energy Demand: Implications for the Determination
of the Accumulated Oxygen Deficit
AARON RUSSELL1,
PETER LE ROSSIGNOL1, and SING KAI LO2
1School of
Health Sciences, Deakin University, Australia, 2Department of
Rehabilitation Sciences, The Hong Kong Polytechnic University, China
AARON RUSSELL, PETER
LE ROSSIGNOL, and SING KAI LO. The Precision of Estimating the Total
Energy Demand: Implications for the Determination of the Accumulated Oxygen
Deficit. JEPonline, Vol 3, No 2,
2000. This study observed the precision of estimating the total energy
demand required to calculate the AOD using three different VO2
- power regressions which included, five VO2
- power regression points and a forced y-intercept of 5.1 ml/kg/min
(5+Y) (1), five VO2
- power regression points without a forced y-intercept of 5.1 ml/kg/min
(5-Y), Medbøs procedure 3(MED) (1). Fourteen well-trained schoolboy
rowers completed a 2000-m performance test, VO2peak
test, five submaximal tests, and an exhaustive 2-min test using rowing
ergometry. There were no differences between the estimated total energy
demand (ETED), AOD and slope of the regression lines when established from
either of the three regression equations. The regressions developed from
methods 5+Y and MED reduced the length of the 95% confidence interval (95%
CI) (p<0.0167) compared to the method 5-Y. 2000-m rowing ergometer
performance was significantly predicted by VO2peak
and the AOD determined by either of methods 5+Y (p = 0.047) and MED (p
= 0.042). The inclusion of a y-intercept value when estimating the total
energy demand with a reduced number of regression points reduces the length
of the 95% CI, increases the precision of the estimated value and therefore
reduces the variability of the AOD measurement. It is suggested that the
length of the 95% CI of the ETED be used as a criteria to measure the degree
of precision in the estimated value. This approach has potential for improving
the reproducibility of the AOD.
Key Words: Rowing
performance, 95% confidence interval, Intense exercise.
INTRODUCTION
The accumulated oxygen deficit (AOD)
is determined as the difference between the estimated total energy demand
(ETED) and the actual measured oxygen uptake during the same exhaustive
exercise bout (1). The total energy demand is estimated
using a linear regression equation developed from the relationship between
several regression points representing steady state oxygen uptake (VO2)
and the corresponding work rate. The accuracy of the AOD method is dependent
in part upon the precision of the ETED required to complete the exhaustive
exercise bout.
Medbø, et al. (1)
claimed that the AOD method provided a reasonable estimate of anaerobic
capacity providing two key criteria were achieved. Firstly, establishing
a linear relationship between submaximal VO2
and power for the development of the regression equation and secondly,
that the measured submaximal values used for the extrapolation are as close
as possible to the ETED required for the AOD test. Medbø, et al.
(1) established these criteria after having subjects
perform approximately 20 submaximal tests representing VO2
and power between 35 100% of VO2max.
Medbø, et al. (1) also developed a more time efficient
method, termed "procedure 3" which required only two measurements between
85 and 100% of VO2max
as well as a common y-intercept value of 5.1 ml/kg/min. The AOD measurement
from "procedure 3" was deemed to be satisfactory as it differed by only
2 ml/kg from Medbø,s original method and produced a high correlation
between VO2
and power (r = 0.999). Several studies investigating the AOD have developed
regression equations to estimate the total energy demand using Medbøs
procedure 3 (1-4). However, many studies have
used modifications of Medbøs control method by using between 5
and 8 regression points representing steady state VO2
and power output data points between 35 and 85% of VO2max,
(5-7). With the exception of one investigation (8),
all these studies have excluded the y-intercept value when using a reduced
number of regression points (<10 regression points) to estimate the
total energy demand. Presently, the effect of reducing the number of regression
points without the inclusion of a y-intercept value on the precision of
estimating the total energy demand and the subsequent influence on the
calculation of AOD is not known.
The precision of the ETED and, therefore,
the measured AOD is generally based on the Pearson correlation coefficient
of the VO2-
power relationship (r >0.99) and /or the standard error of the estimate
(0.2 - 0.7 ml/kg/min) (9,10). Recently, Buck and McNaughton
(1999) investigated the impact of using less than 10 regression points
on the Pearson correlation coefficient of the VO2-
power relationship and the standard error of the estimate. In this study
a standard regression based on 10 x 10 min submaximal intensities between
30 and 90% of VO2max
was developed. Following this the lowest intensity was removed from
the regression and a new VO2-power
regression was developed using 9 points. This process was repeated until
only two points remained. An identical process was again used however,
with the initial removal of the highest regression points first.
The same process was used for a third time but with the most central points
removed until only the highest and lowest points remained. The results
from this study indicated that decreasing the number of regression points
still produced Pearson correlation coefficient's of 0.99 or greater however,
the regressions resulted in differences in the AOD that were much greater
than the standard error of the estimate (11). These
observations question the use of the Pearson correlation coefficient as
the main indicator of the precision of the ETED and therefore an alternative
criterion may be required. The 95% confidence interval (95% CI) of
the ETED offers an additional criterion which can be used for measuring
the precision at a point on the regression line. The precision of an estimated
value in a regression can be found by calculating the variance, and hence
the standard error (SE) associated with the estimation (12).
The standard error can also be used to compute a confidence interval (13).
Confidence intervals (CIs) can therefore be used as alternate measures
of precision. The use of CIs is more general than that of SEs, for the
latter are readily interpreted only when the quantity to which they are
attached is approximately normal in distribution (14).
Therefore a shorter CI indicates a more precise estimate.
The present study was therefore designed
to examine the precision of estimating the required total energy demand
and AOD when using a reduced number of regression points combined with
and without the y-intercept value. This was achieved using three
different methodological approaches. Precision was quantified by the length
of the 95% CI's. Additionally, the AOD values calculated using the
three different regression methods were combined with individual VO2peak
values to observe whether the precision of the ETED and therefore the individually
calculated AODs, affected the prediction of 2000-m rowing ergometer performance.
An understanding of the influence of the y-intercept value when reducing
the number of regression points as well as the use of the 95% CI as an
indicator of precision will assist in improving the AOD methodology by
allowing the selection of regression equations which more precisely estimate
the total energy demand.
METHODS
The subjects consisted of 14 elite male
schoolboy rowers from three different coxed eight rowing crews. Their
mean (±SD) age, height, weight and VO2peak
were 17.1±0.5 years, 186.1±4.7 cm, 85.2±8.7 kg, 53.8±6.5
ml/kg/min respectively. The subjects were asked not to participate in any
physical activity 24 hours prior to testing and to abstain from eating
for three hours. The subjects were familiar with the Concept II©
rowing ergometer used in the study. Informed consent was obtained
from each subject, and the University Ethics Committee approved the experiment.
2000-m Performance
A 2000-m rowing ergometer test was
undertaken (Concept II©, Morrisville, Vermont, U.S.A) to assess rowing
performance time and the average power required to row 2000-m.
Establishing Individual Regression
Equations
The various individual regression equations
were determined by plotting different combinations of the VO2
- power co-ordinates. Firstly a VO2-power
relationship was established using the VO2
(ml/kg/min) values measured at 50, 60, 70, 80, and 90% of the average power
measured during the 2000-m rowing ergometer test and the corresponding
work rates (W) combined with a resting VO2
value of 5.1 ml/kg/min (5+Y) (1). Secondly, a VO2-power
relationship was determined using the above VO2
values and corresponding work rates without a resting VO2
value of 5.1 ml/kg/min (5-Y). Finally, a regression equation was developed
based on Medbo' s procedure 3 which included points at 80% and 90% of
the average power measured during in the 2000-m row plus a common resting
VO2
value of 5.1 ml/kg/min (MED) (1). These intensities respectively
corresponded to between 75 and 82% and 85 and 92% of individual VO2peak.
Measuring Submaximal VO2
and VO2peak
Five submaximal tests were performed
on the Concept II© rowing ergometer at intensities of 50, 60, 70,
80 and 90% of the average power measured during the 2000-m rowing ergometer
test and were set using a 2000-m chart with 500-m split times (15).
As the intensity of the submaximal tests increased, 500-m split times were
decreased by either 5 or 6 s depending on the required intensity (15).
Test duration for each submaximal test was 5 - 7 min with a 10-min recovery
between each work rate. The submaximal VO2
was measured when a steady state heart rate was achieved. Steady
state was deemed to be reached when heart rate did not vary by any more
than 5 beats over a 2-min period. Power output during the submaximal
tests was obtained as the average power as indicated on the monitor of
the Concept II rowing ergometer at the end of each test. Heart rates
were measured using a Polar heart rate monitor (Polar Electro, Hakamaantie,
Kemple, Finland). When steady state was reached expired gases were
collected in Douglas bags for a further minute. VO2peak
was established by increasing the work rate after the 90% trial was completed.
To measure VO2peak
the 500m split time was decreased by 4 s each minute until it could not
be held for three consecutive stokes. Expired gas was collected in
Douglas bags for each 60 s work rate during the maximal test, with the
bags analyzed to determine VO2peak.
VO2peak
was determined as the highest VO2
value obtained from the bags. VO2
was analyzed by evacuating 21 L of the expired gas from the Douglas bags
and pushing it into the Gould 2900 metabolic cart using a Hans Roudolph
7 L syringe attached to a 2 way valve. The fraction of expired oxygen
(FEO2)
and the fraction of expired carbon dioxide (FECO2)
were established approximately 90-s after the expired sample had been pushed
into the oxygen and carbon dioxide analyzers of the metabolic cart. Ninety
seconds allowed for the replacement of the previous gases with the gases
from the Douglas Bag. Ventilation (VE)
was determined by evacuating the rest of the contents of each bag using
the 7 L Hans Rudolph syringe and adding the 21 L of gas that had all ready
been evacuated. The syringe was calibrated against a 120 L Tissot spirometer
by withdrawing 70 L of air from the spirometer on 10 occasions. The coefficient
of variation for the syringe was 0.15 % with a systematic error of ?0.89%
(4). VO2
was then calculated from the FEO2,
FECO2
and VE measurements which were representative of each bag.
Establishing the Accumulated Oxygen
Deficit (AOD)
An exhaustive test was performed at
a constant work rate between 120 and 130% of VO2peak
work rate to determine the AOD (1). The total energy demand required for
the exhaustive test was estimated by extrapolation from the individual
regression equations established from the submaximal tests (1).
Exhaustion occurred when the subjects voluntarily stopped rowing or when
the required split time was unable to be maintained for more than three
strokes. Douglas bags were used to collect the expired gas for the
entire duration of the AOD test. Exercise duration was between 1.75
and 2.5 min. The oxygen uptake during the AOD test was determined by analyzing
the expired gas in the Douglas bags using the same procedure as for the
submaximal tests. The AOD was established by subtracting the measured
accumulated oxygen uptake from the estimated oxygen demand required to
complete the exhaustive AOD tests (1).
Statistical Analysis
Regression equations were developed
for each subjects VO2-power
relationship so that their total energy demand and AOD could be calculated.
Three regression equations were developed for each subject using the methods
5+Y, 5-Y and MED. Along with each individuals ETED and AOD, other
statistics calculated for each of the three methods included the slope,
the standard error of the predicted value (SEP), the Pearson correlation
coefficient of the VO2-
power relationship and the 95% CI associated with the ETED.
The SEP is provided as opposed to the commonly used standard error of the
estimate (SEE). The SEP is more precise than the SEE as the SEE is
a broad term and may refer to the SE of the intercept or SE of the slope
(both a and b in the equation y = a+bX). Repeated measures ANOVA,
followed by all pairwise linear contrasts, were performed to test for differences
in the dependent variables derived from the three different regression
equations. Multiple linear regression was also used to investigate the
prediction of rowing performance when combining VO2peak
with the AOD values established using the different methods. The
adjusted multiple R, as opposed to the sample multiple R, was used to assess
the proportion of variance explained by the independent variables (16).
All statistics were performed using SPSSX Inc. statistical software (17).
The Bonferoni adjustment was made for the repeated measures ANOVA so that
the significance level was set at 0.0167. For all other analysis the 0.05
level was used to determine statistical significance.
RESULTS
Table 1 indicates mean group data for
the dependent variables measured using the regression methods 5+Y, 5-Y
and MED
Table 1. Results for the estimated
total energy demand (ETED), the length of the 95% confidence interval (95%
CI), the accumulated oxygen deficit (AOD), the slope of the regression
line, the - power correlation coefficient (r) and the standard error
of the predicted value (SEP) when using the methods the regression methods,
5+Y, 5-Y and MED.
| Variable |
5+Y |
5-Y |
MED |
ETED
(ml/kg/min) |
71.28±9.49 |
74.26±6.20 |
70.23±7.93 |
AOD
(ml/kg/min) |
27.84±9.48 |
30.82±6.20 |
26.79±7.93 |
| Slope (ml/kg/min/W) |
0.15±0.02 |
0.15±0.04 |
0.15±0.01 |
SEP
(ml/kg/min) |
1.58±0.41 |
4.12±2.25* |
1.31±0.69 |
| r |
0.991±0.009 |
0.966±0.041 |
0.998±0.000* |
95% CI
(ml/kg/min) |
12.88±2.93 # |
27.63±14.47 # |
16.89±10.07 |
All values are mean±S.D.
* significantly different compared
to the other methods (p< 0.0167)
# significantly different from each
other (p< 0.0167)
There was no significant difference
between the ETED, AOD and the slope of the regression line when using the
3 different methods. The inclusion of a constant y-intercept when developing
the regression equation resulted in a lower SEP (p = 0.002) as well as
a reduction in the length of the 95% CI for the ETED (p = 0.004) compared
to using the method 5-Y. The SEP was lower (p = 0.001) when using the method
MED compared to method 5-Y. The Pearson correlation coefficient for the
regression line established using method MED was higher than for the other
two methods (p<0.0167). There was however no difference between
the SEP (p = 0.200) and the length of the 95% CI (p = 0.173) when using
the methods 5+Y or MED.
Although there was no significant difference
between the mean AOD values measured using the three different methods
multiple regression analysis indicated that when combing the AOD values
with VO2peak
there was a different explanation or prediction of rowing performance (Table
2). The power of prediction was increased by approximately 45% when
the y-intercept value was forced in the regression with five regression
points. A similar level of prediction was observed for method MED.
Table 2. Multiple regression
equations, adjusted R, standard error of the predicted value (SEP), independent
P-values and significance for the prediction of 2000-m rowing ergometer
performance using the AOD measured from the 3 different methods combined
with peak.
| Variable |
5+Y |
5-Y |
MED |
Multiple
regression
equation |
2000-m time (min) = 6.601 - 0.018 x
(AOD) + 0.010 x (VO2peak) |
2000-m time (min) = 7.258 - 0.021 x
(AOD) - 0.00006 x (VO2peak) |
2000-m time (min)
= 6.603 - 0.022 x (AOC) + 0.012 x (VO2peak) |
| Adjusted R |
0.323 |
0.187 |
0.335 |
| SEP |
0.190 |
0.208 |
0.188 |
| P-value AOD |
0.016 |
0.049 |
0.014 |
| P-value VO2peak |
0.297 |
0.943 |
0.232 |
| Sig |
0.047 |
0.128 |
0.042 |
The inclusion of a y-intercept value
when reducing the number of regression
points decreases the length of the
95% CI as can be seen for an individual subject in Figure 1.
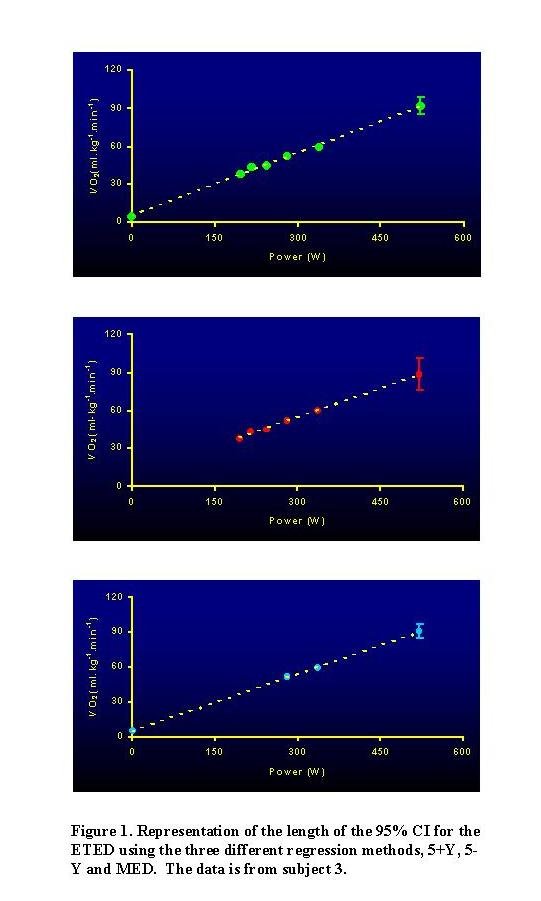
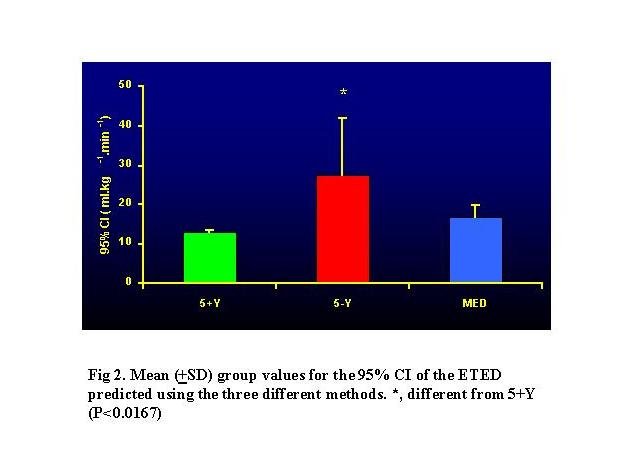
Figure 2 shows the group mean values
of the length of the 95% CI. The length of the 95% CI from method 5+Y was
53% less than the 95% CI from method 5-Y.
DISCUSSION
The precision of the ETED was observed
using three commonly used AOD methods calculated individually on 12 schoolboy
rowers. The different regression methods resulted in similar mean ETED's
and AOD values. However when using a reduced number of regression points,
the method 5+Y significantly increased the precision of the ETED as indicated
by a shorter 95% CI when compared to the method 5-Y. The length of
the 95% CI was similar for the methods 5+Y and MED. Collectively, these
results demonstrate that estimating the total energy demand with a reduced
number of regression points requires a y-intercept. As one of the main
limitations of the AOD method surrounds the precision of estimating the
total energy demand, the inclusion of the y-intercept and establishing
the 95% CI provides a more precise estimation of the total energy demand.
Previously, the strength of the correlation
coefficient of the regression equation as well as the standard error of
the estimate (SEE) have been used to establish linearity between VO2
and power at submaximal work rates. These criteria have been used
to support the AOD method as an appropriate way of estimating the total
energy demand for exhaustive exercise above VO2peak
intensity (1,9). As indicated by our
results similar correlation coefficients can be obtained using different
methods, however the variability in the estimated value can modulate significantly.
The strength of the correlation coefficient and standard error of the estimate
is dependent upon the number of points used to establish the VO2-power
relationship, as well as the spread of the points along the x-axis.
Therefore a high correlation coefficient and low standard error of the
regression may only be an artifact of the method used to develop the regression
equation. As two regression points will always reveal a prefect correlation
coefficient of 1.00, it is not surprising that three points will produce
a relatively high correlation coefficient and low SEE. This has been
demonstrated in several studies using Medbøs procedure 3 (2,4,19).
This can be observed in our data as the method MED resulted in a higher
correlation coefficient, a smaller standard error of the predicted value
(SEP) and a smaller standard deviation for the estimated value compared
to the method 5+Y. This observation is not surprising, as fewer regression
points will artificially improve a point estimate. We have given the SEP
instead of the SEE as the SEE is a broad term and may refer to the SE of
the intercept or SE of the slope (both a and b in the equation y = a+bX).
Our data suggest that the method MED produces a more linear relationship
that could be misconstrued as producing a more precise estimation of the
total energy demand and AOD. However, the 95% CI is longer for the
ETED using method MED compared to method 5+Y. The shorter mean 95% CI for
the total energy demand estimated from the method 5+Y indicates that the
individually estimated total energy demands and therefore AOD produce less
variability within individuals. This demonstrates an increased precision
when estimating the total energy demand and hence a more precisely calculated
AOD.
It is suggested that this observation
of a larger variability for the ETED when using a small number of regression
points with no y-intercept may also have occurred in previous studies (9,20,21).
In the present study there was a mean 39-53% increase in the error or variability
of the ETED established from the method 5-Y compared to the methods MED
and 5+Y, respectively. Several studies investigating the difference
in the AOD between athletes from different sporting events and the influence
of training have estimated the total energy demand using a small number
of regression points with no y-intercept (20,23).
It is possible that using such a method may have reduced the precision
of their measurements. It is suggested that both training changes and differences
in AOD between sprint, middle distance and endurance athletes may be more
precisely assessed if the variability in the energy demand due to the chosen
regression points is reduced. High levels of precision for the calculation
of AOD should be achieved before the method is tested for its repeatability.
It is possible that only moderate levels (r= 0.89) of reliability for the
AOD (24) and previous poor relationships between AOD
and invasive indicators of anaerobic potential (21,25)
may have been confounded by low precision in the measurement of the ETED
and hence the AOD value. The above studies have not reported the variability
in the individually ETED which may have been reduced with the inclusion
of a wider spread of regression points and a y-intercept value. Another
potential limitation influencing the precision of the ETED is the measurement
of steady-state VO2 during high intensity
exercise. It has commonly been observed during cycling exercise that steady-state
VO2
may be delayed or not attained at high intensities above the lactate threshold
due to the VO2
slow component (SC) (26,27). The
SC causes a non-linear rise in VO2
at these high intensities that may effect the precise estimation of the
total energy demand. The effect of the SC on the precision of the ETED
is currently not known.
The relationship between performance
and AOD has previously been investigated in sprint and middle distance
events. Good examples are 4000-m individual pursuit track cycling (28)
and 100-m, 200-m, 400-m and 800-m and 1500-m running events (6).
Previously no study had observed the relationship between 2000-m rowing
ergometer performance and AOD. Rowing is classed as a middle distance
event of approximately six min duration and scientific opinion suggests
that between 20-30% of the energy demand is from anaerobic sources (29,30).
It can be hypothesized that the AOD will relate to 2000-m rowing ergometer
performance. As the AOD values were determined using the same submaximal
intensities a univariate correlation between AOD and rowing performance
cannot be performed due to colinearity. However multiple linear regression
analysis indicated that the combination of VO2peak
and the AOD values measured from the methods 5+Y and MED significantly
predicted 2000-m rowing ergometer performance. Using the method 5-Y
when establishing the AOD did not significantly predict performance when
the AOD was combined with VO2peak.
Interestingly, a trend exists between the prediction of performance when
using multiple linear regression, the p-value of the AOD in the multiple
linear regression and the length of the 95% CI of the ETED.
It appears that the prediction of performance and the P-value of the AOD
within the prediction equation is improved when the AOD value is more precisely
measured. More precision is indicated by a shorter 95% CI for the
ETED. As only three data sets are available a Pearson product-moment correlation
cannot be established to provide statistical significance of the relationship
between the magnitude of the 95% CI and the correlation between AOD, VO2peak
and performance. It is reasonable to suggest that the stronger relationship
between AOD and performance when the variability of the ETED and the calculated
AOD is reduced, lends support for the more precise measure of AOD as being
a more discerning measure of anaerobic capacity.
In summary, the variability of the ETED
as indicated by the magnitude of the 95% CI is significantly decreased
when using the method 5+Y. Additionally, the improved prediction
of 2000-m rowing ergometer performance time when combining VO2peak
and the AOD measured using a y intercept and a wide spread of regression
points may be related to the more precisely ETED. Using the method 5-Y
greatly increases the variability associated with the ETED and reduces
the precision of the AOD calculation. This less precise calculation of
AOD may be too variable to correlate significantly to 2000m rowing performance
time. This study demonstrates that the SEP and a high correlation coefficient
of the regression line alone do not sufficiently indicate the more precise
or confident measure of the ETED. Therefore the calculated AOD may be an
artifact of the number and spread of regression points. It is suggested
that the length of the 95% CI of the ETED be used as criteria to establish
the precision of the estimated value. Additionally a wide spread
of work rates including a y-intercept value should be instigated when only
a small number of points are utilized in the regression. This approach
is likely to improve the reliability of the AOD method.
REFERENCES
1. Medbø JI,
Mohn A-C, Tabata I, Bahr R, Vaage O, Serjersted OM. Anaerobic capacity
determined by maximal accumulated O2
deficit. J Appl Physiol 1988;64:50-60.
2. Ramsbottom R, Nevill
AM, Nevill ME, Newport S, Williams C. Accumulated oxygen deficit and short-distance
running performace. J Sports Sci 1994;12:447-453.
3. Ramsbottom R, Nevill
ME, Nevill AM, Hazeldine R. Accumulated oxygen deficit and shuttle run
performance in physically active men and women. J Sports Sci 1997;15:207-214.
4. Wadley G, LeRossignol
PF. The relationship between repeated sprint ability and the aerobic and
anaerobic energy systems. J Sci Med Sports 1998;1:100-110.
5. Medbø JI,
Tabata I. Relative importance of aerobic and anaerobic energy release during
short-lasting exhausting bicycle exercise. J Appl Physiol 1989;67:1881-1886.
6. Weyand PG, Cureton
KJ, Conley DS, Sloniger MA, Lin Liu Y. Peak oxygen deficit predicts sprint
and middle-distance track performance. Med Sci Sports Exerc 1994;26:1174-1180.
7. Green S, Dawson
BT. Methodological effects on the VO2-power
regression and the accumulated O2
deficit. Med Sci Sports Exerc 1996;28:392-397.
8. Faina M, Billat
V, Squadrone R, De Angelis M, Koralsztein JP, Dal Monte A. Anaerobic contribution
to the time to exhaustion at the minimal exercise intensity at which maximal
oxygen uptake occursin elite cyclists, kayakists and swimmers. Eur J
Appl Physiol 1997;76:13-20.
9. Olesen HL, Raabo
E, Bangsbo J, Secher NH. Maximal oxygen deficit of sprint and middle distance
runners. Eur J Appl Physiol 1994;69:140-146.
10. Pizza FX, Naglieri
TA, Holtz RW, et al. Maximal accumulated oxygen deficit of resistance-trained
men. Can J Appl Physiol 1996;21:391-402.
11. Buck D, McNaughton
LR. Changing the number of submaximal exercise bouts effects calculation
of MAOD. Int J Sports Med 1999;20:28-33.
12. Selvin S. Practical
biostastical methods. Belmont, California, U.S.A: Duxbury Press, 1995:44-45.
13. Stanton A, Slinker
B. Primer of applied regression and analysis of variance. New York,
U.S.A: McGraw-Hill, 1990:24-25.
14. Bailey NTJ. Statistical
methods in biology. London: The English University Press, U.K, 1959:23-24.
15. Hahn A. Identification
and selection of talent in Australian rowing. Excel 1990;6:5-11.
16. Russell AP, Le
Rossignol PF, Sparrow WA. Prediction of elite schoolboy 2000 m rowing ergometer
performance from metabolic, anthropometric and strength variables. J
Sports Sci 1998;16:749-54.
17. Kinnear P, Gray
C. SPSS for windows made simple Hore: Lea: Hore:Lea, 1994.
18. Tabata I, Irisawa
K, Kouzaki M, Nishimura K, Ogita F, Miyachi M. Metabolic profile of high
intensity intermittent exercises. Med Sci Sports Exerc
1997;29:390-395.
19. Maxwell NS, Nimmo
MA. Anaerobic capacity: a maximal anaerobic running test versus the maximal
accumulated oxygen deficit. Can J Appl Physiol 1996;21:35-47.
20. Medbø
JI, Burgers S. Effect of training on the anaerobic capacity.
Med Sci
Sports Exerc 1990; 22:501-507.
21. Bangsbo J, Michalsik
L, Petersen A. Accumulated O2
deficit during intense exercise and muscle characteristics of elite athletes.
Int
J Sports Med 1993;14:207-213.
22. Gastin PB, Lawson
DL. Influence of training status on maximal accumulated oxygen deficit
during all-out cycle exercise. Euro J Appl Physiol 1994 (a);69:321-330.
23. Green S, Dawson
BT. The oxygen uptake-power regression in cyclists and untrained men: implications
for the accumulated oxygen deficit. Euro J Appl Physiol 1995;70:351-359.
24. Foster C, Hector
L, McDonald K, Snyder A. Measurement of anaerobic power and capacity. In:
Maud P, Foster C, eds. Physiological assessment of human fitness.
Champaign, IL.: Human kinetics, 1995:73-85.
25. Green S, Dawson
BT, Goodman C, Carey MF. Anaerobic ATP production and accumulated O2
deficit in cyclists.
Med Sci Sports Exerc 1996;28:315-321.
26. Barstow TJ, Molé
PA. Linear and nonlinear characteristics of oxygen uptake kinetics during
heavy exercise. J Appl Physiol 1991;71:2099-2106.
27. Zoladz JA, Rademaker
ACHJ, Sargeant AJ. Non-linear relationship between O2
uptake and power output at high intensities of exercise in humans. J
Physiol 1995;488:211-217.
28. Craig NP, Norton
KI, Conyers RA, et al. Influence of test duration and event specificity
on maximal accumulated oxygen deficit of high performance track cyclists.
Int
J Sports Med 1995;16:534-540.
29. Hagerman FC. Applied
physiology of rowing. Sports Med 1984;1:303-26.
30. Droghetti P,
Jensen K, Nilsen TS. The total estimated metabolic cost of rowing. FISA
Coach 1991;2:1-4.
Address
for Correspondence: Aaron
Russell, Biochimie Medicale, Geneve University, 1 rue Michel Servat,
1211 Geneve, Phone number: +41 22 702 54 94, FAX number: +41 22 702 55
02, email: Aaron.Russell@medicine.unige.ch
Copyright © 1997-2000
American Society of Exercise Physiologists. All rights reserved.
ASEP
Table of Contents
PEPonline
JEPonline
- April 2000